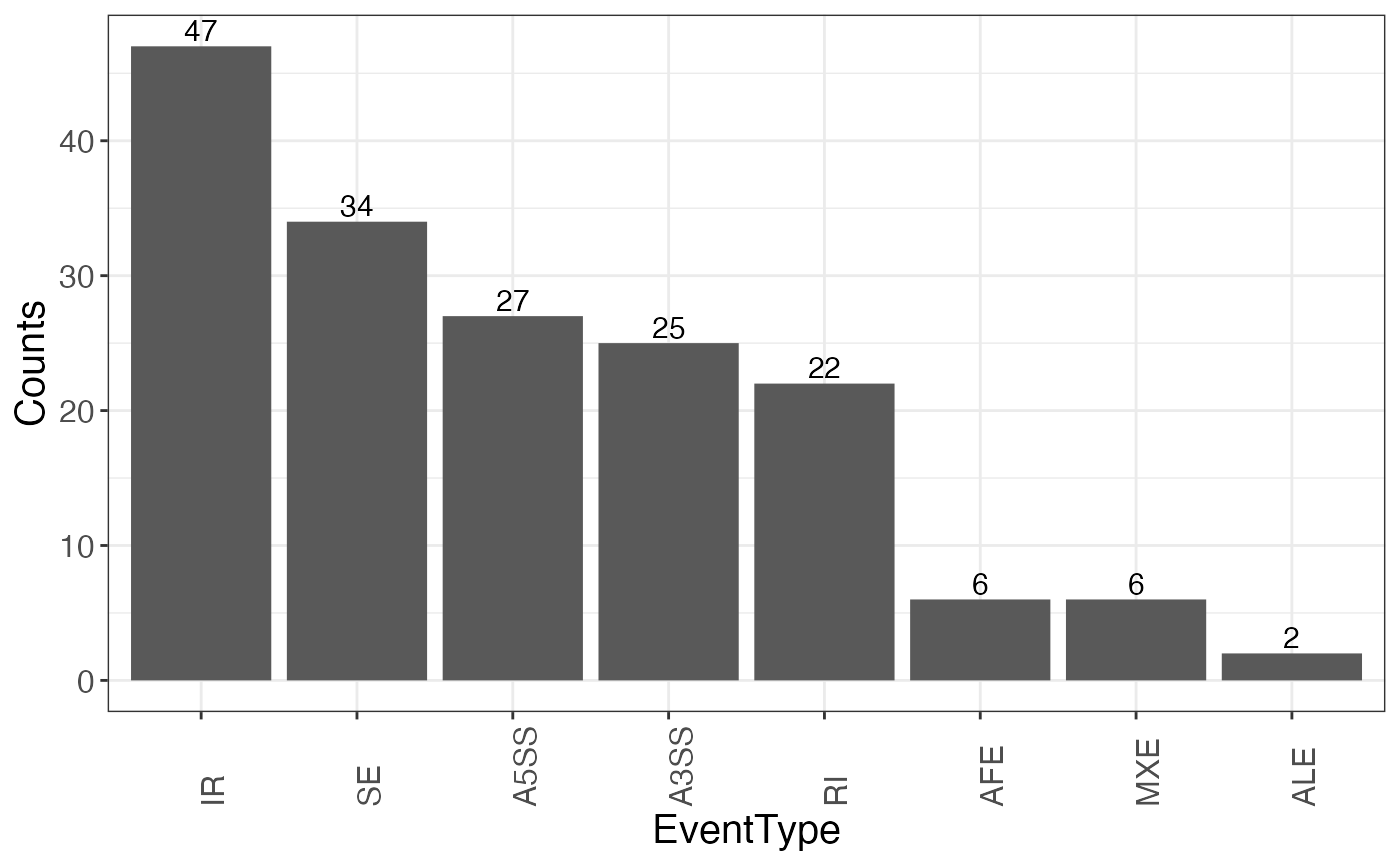
Generate a barplot showing counts of alternate splice events from the object NxtSe.
Source:R/splicewiz_wrappers.R
get_ASE_counts_barplot.RdThis plot is useful to show counts of filtered spliced events once spliceWiz filters are applied.
Arguments
- x
an object of class
NxtSE. Usuallyseorse.filtered.- elem_text_size
an integer denoting size of the various text elements in the plot.
- text_count_size
an integer denoting size of the counts mentioned above each bar.
Examples
se <- SpliceWiz::SpliceWiz_example_NxtSE(novelSplicing = TRUE)
get_ASE_counts_barplot(se, elem_text_size = 15, text_count_size = 4)