Visualise alignment stats in a bar plot
Usage
get_star_align_log_summary_plot(
  x,
  is_paired_data = TRUE,
  col_total_reads = "#007e2f",
  col_mapped_reads = "#ffcd12"
)
Arguments
- x
a named character vector denoting paths to *Log.final.out file generated by STAR aligner. Names will be used to label Y axis in the plot. If not named, file names will be used to label.
- is_paired_data
a logical, default TRUE, denoting whether data is paired or single end. By default STAR counts a paired-end read as one read. When
is_paired_dataset toTRUEit doubles the count of total and mapped reads.- col_total_reads
a character string denoting bar color total reads. Default "#007e2f".
- col_mapped_reads
a character string denoting bar color total reads. Default "#ffcd12".
Examples
file_dir <- system.file("extdata",package = "parcutils")
file_paths <- fs::dir_ls(path = file_dir,
glob = "*Log.final.out" , recurse = TRUE, type = "file") %>% as.character()
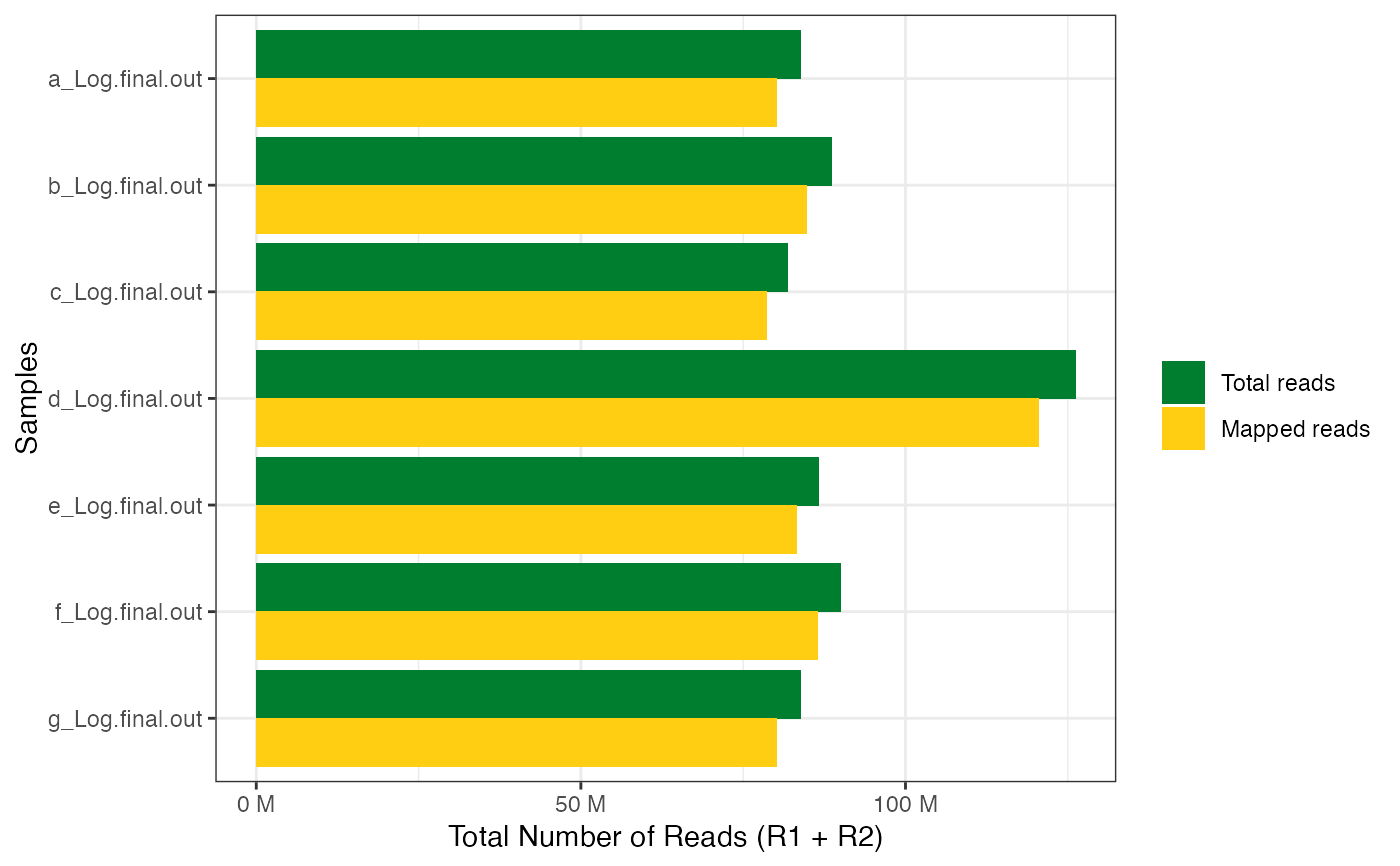
get_star_align_log_summary_plot(x = file_paths)
#>
#> ── Column specification ────────────────────────────────────────────────────────
#> cols(
#> sample = col_character(),
#> `Number of input reads` = col_double(),
#> `Uniquely mapped reads number` = col_double(),
#> `Uniquely mapped reads %` = col_character()
#> )
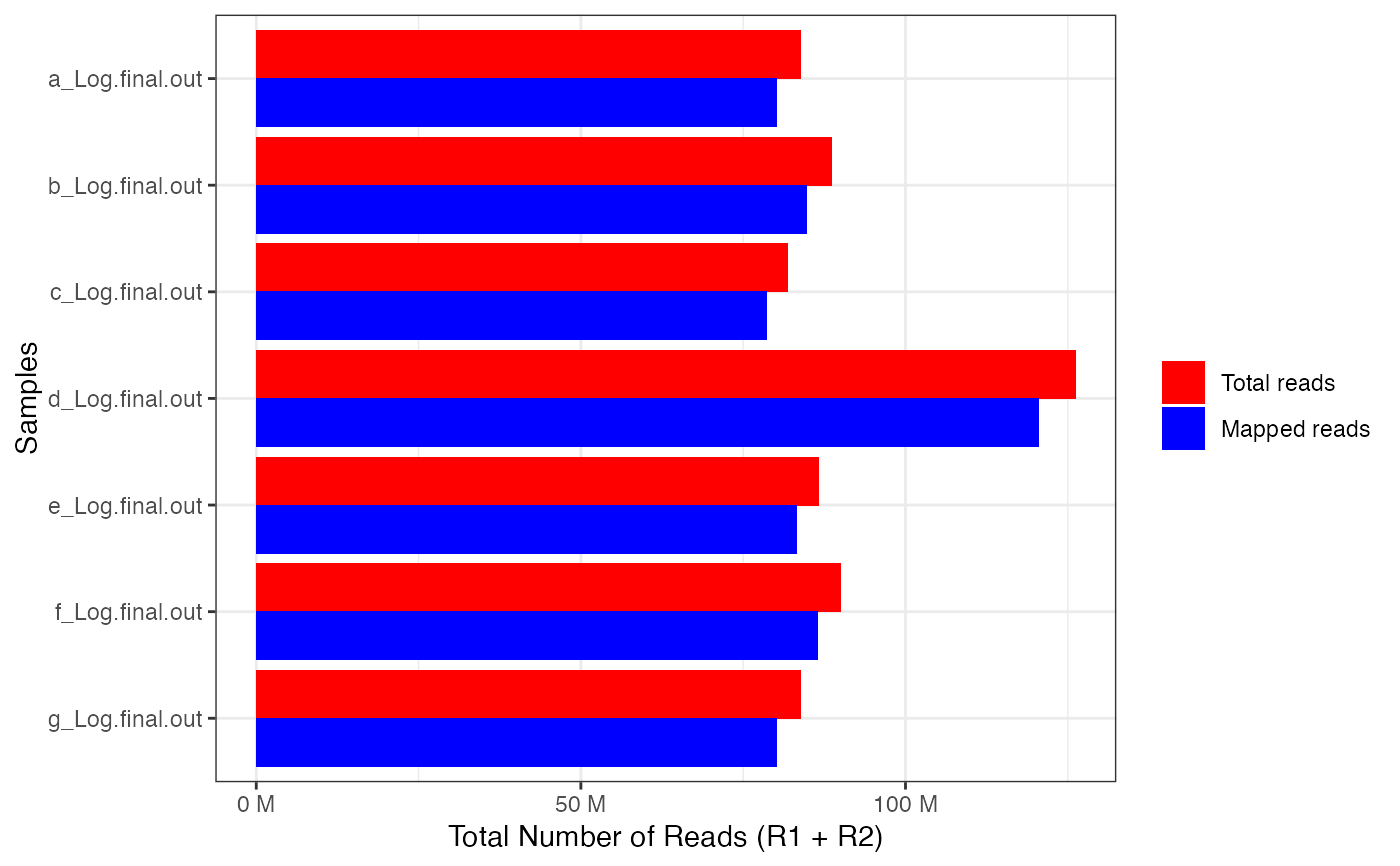
 get_star_align_log_summary_plot(x = file_paths, col_total_reads = "red",
col_mapped_reads = "blue")
#>
#> ── Column specification ────────────────────────────────────────────────────────
#> cols(
#> sample = col_character(),
#> `Number of input reads` = col_double(),
#> `Uniquely mapped reads number` = col_double(),
#> `Uniquely mapped reads %` = col_character()
#> )
get_star_align_log_summary_plot(x = file_paths, col_total_reads = "red",
col_mapped_reads = "blue")
#>
#> ── Column specification ────────────────────────────────────────────────────────
#> cols(
#> sample = col_character(),
#> `Number of input reads` = col_double(),
#> `Uniquely mapped reads number` = col_double(),
#> `Uniquely mapped reads %` = col_character()
#> )