Generate a volcano plot.
Usage
get_volcano_plot(
  x,
  sample_comparison,
  log2fc_cutoff = 1,
  pval_cutoff = 0.05,
  genes_to_display = NULL,
  lab_size = 3,
  point_size = 1,
  repair_genes = TRUE,
  col_up = "#a40000",
  col_down = "#007e2f",
  col_other = "grey",
  ...
)
Arguments
- x
an abject of class "parcutils". This is an output of the function
run_deseq_analysis().- sample_comparison
a character string denoting a valid differential gene comparison. Possible comparisons can be found from x$de_comparisons.
- log2fc_cutoff
a numeric value, default 1.
- pval_cutoff
a numeric value, default 0.05.
- genes_to_display
a character vector of the genes to display in volcano plot, default NULL, displays non overlapping genes.
- lab_size
a numeric value, default 3, denoting size of the lables.
- point_size
a numeric value, default 1, denoting size of the points
- repair_genes
logical, default
TRUE, indicating whether to repair gene names. See details.- col_up
a character string, default "a40000", denoting valid color code for up regulated genes.
- col_down
a character string, default "007e2f", denoting valid color code for down regulated genes.
- col_other
a character string, default "grey", denoting valid color code for other than up and down regulated genes.
- ...
other parameters to be passed to
EnhancedVolcano::EnhancedVolcano()
Details
repair_genes: Internally gene names are stored as a "gene_id:gene_symbol" format. For example, "ENSG00000187634:SAMD11". Whenrepair_genesis set toTRUEthe string corresponding to gene_id followed by ":" will be removed. This is useful when gene names to be revealed in the volcano plot.
Examples
count_file <- system.file("extdata","toy_counts.txt" , package = "parcutils")
count_data <- readr::read_delim(count_file, delim = "\t")
#> Rows: 5000 Columns: 10
#> ── Column specification ────────────────────────────────────────────────────────
#> Delimiter: "\t"
#> chr (1): gene_id
#> dbl (9): control_rep1, control_rep2, control_rep3, treat1_rep1, treat1_rep2,...
#>
#> ℹ Use `spec()` to retrieve the full column specification for this data.
#> ℹ Specify the column types or set `show_col_types = FALSE` to quiet this message.
sample_info <- count_data %>% colnames() %>% .[-1] %>%
tibble::tibble(samples = . , groups = rep(c("control" ,"treatment1" , "treatment2"), each = 3) )
res <- run_deseq_analysis(counts = count_data ,
sample_info = sample_info,
column_geneid = "gene_id" ,
group_numerator = c("treatment1", "treatment2") ,
group_denominator = c("control"))
#> ℹ Running DESeq2 ...
#> converting counts to integer mode
#> Warning: some variables in design formula are characters, converting to factors
#> estimating size factors
#> estimating dispersions
#> gene-wise dispersion estimates
#> mean-dispersion relationship
#> final dispersion estimates
#> fitting model and testing
#> ✔ Done.
#> ℹ Summarizing DEG ...
#> ✔ Done.
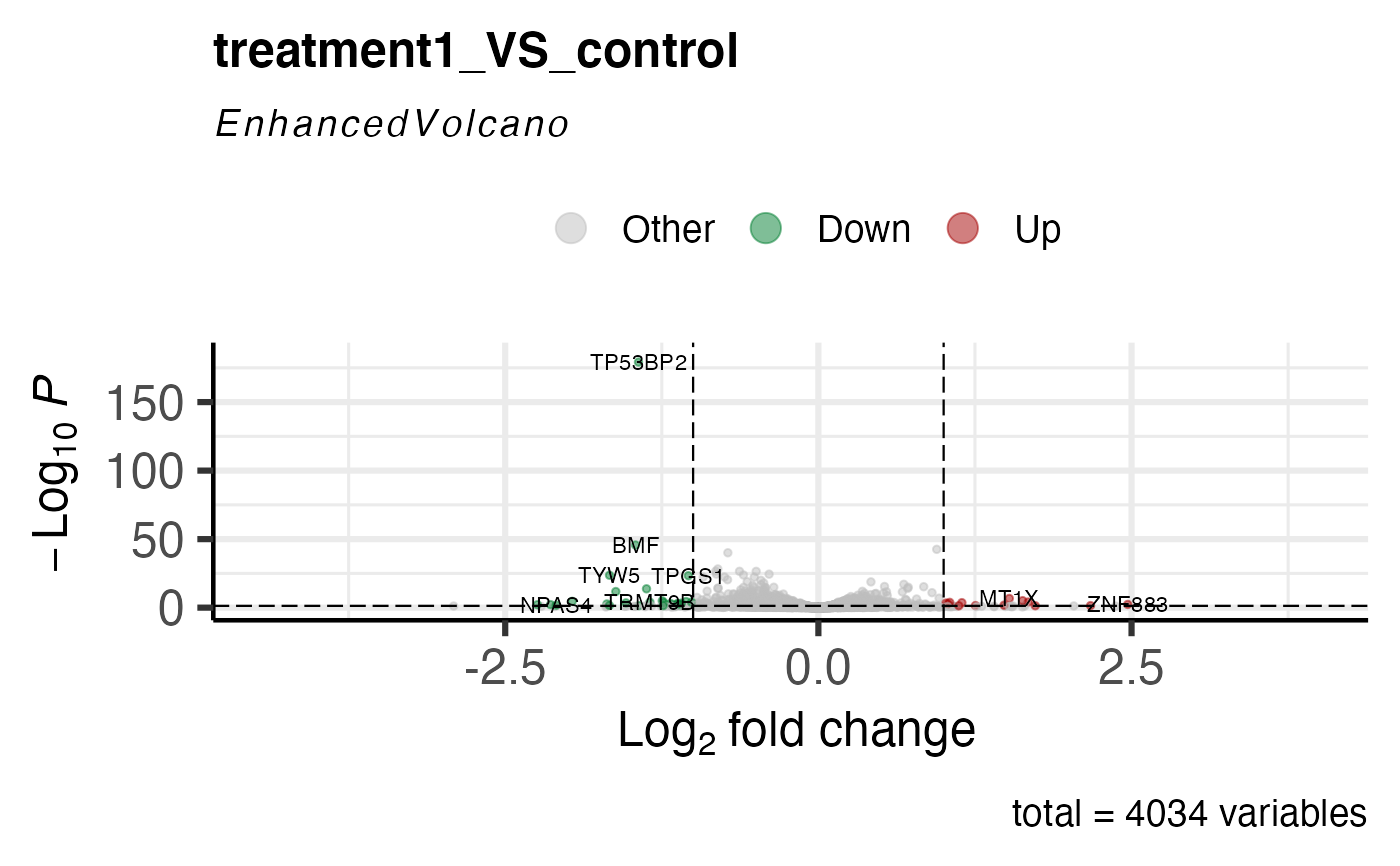
get_volcano_plot(res, sample_comparison = res$de_comparisons[1]) %>% print()
#> Warning: Ignoring unknown parameters: xlim, ylim
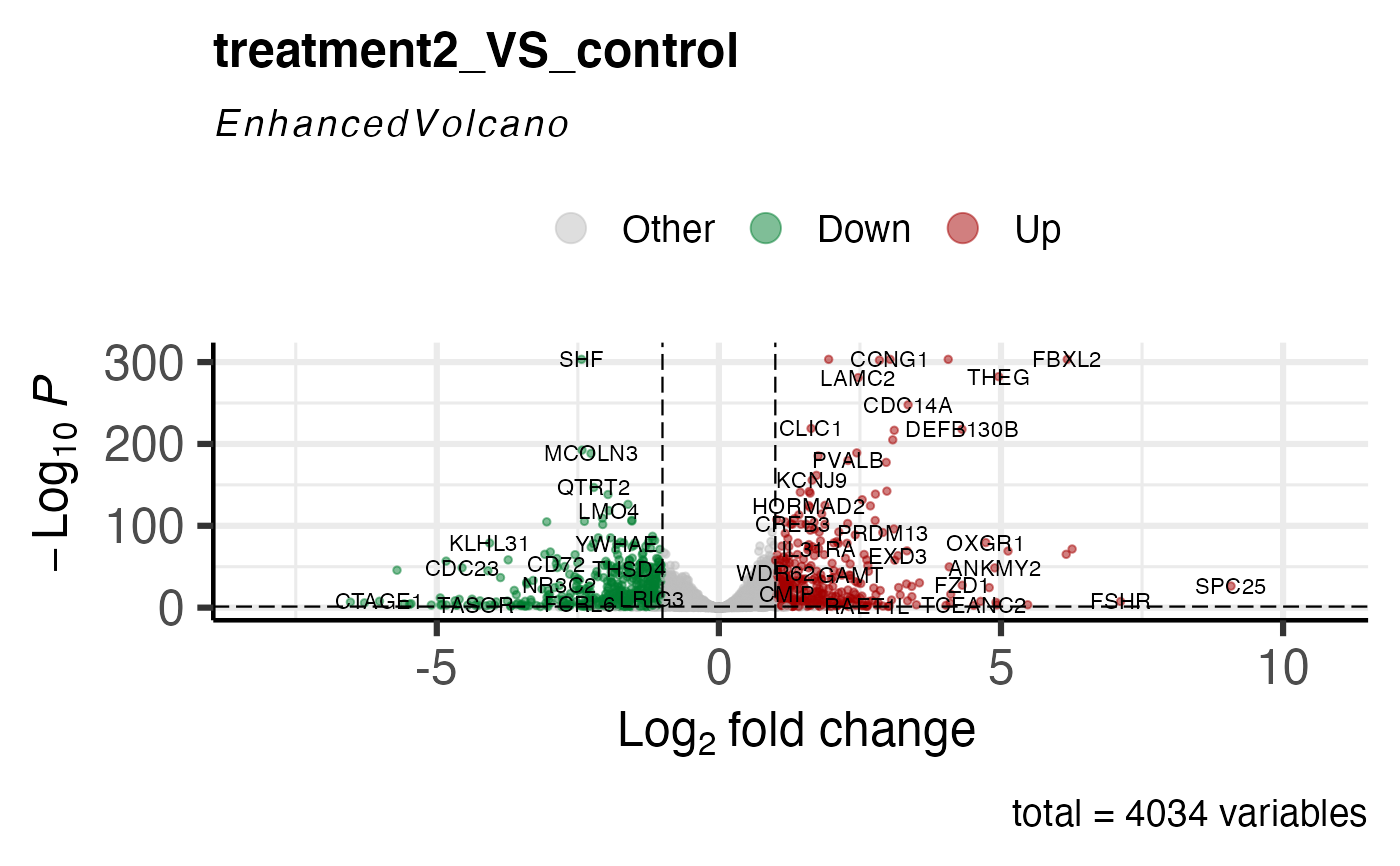
 get_volcano_plot(res, sample_comparison = res$de_comparisons[2]) %>% print()
#> Warning: One or more p-values is 0. Converting to 10^-1 * current lowest non-zero p-value...
#> Warning: Ignoring unknown parameters: xlim, ylim
get_volcano_plot(res, sample_comparison = res$de_comparisons[2]) %>% print()
#> Warning: One or more p-values is 0. Converting to 10^-1 * current lowest non-zero p-value...
#> Warning: Ignoring unknown parameters: xlim, ylim
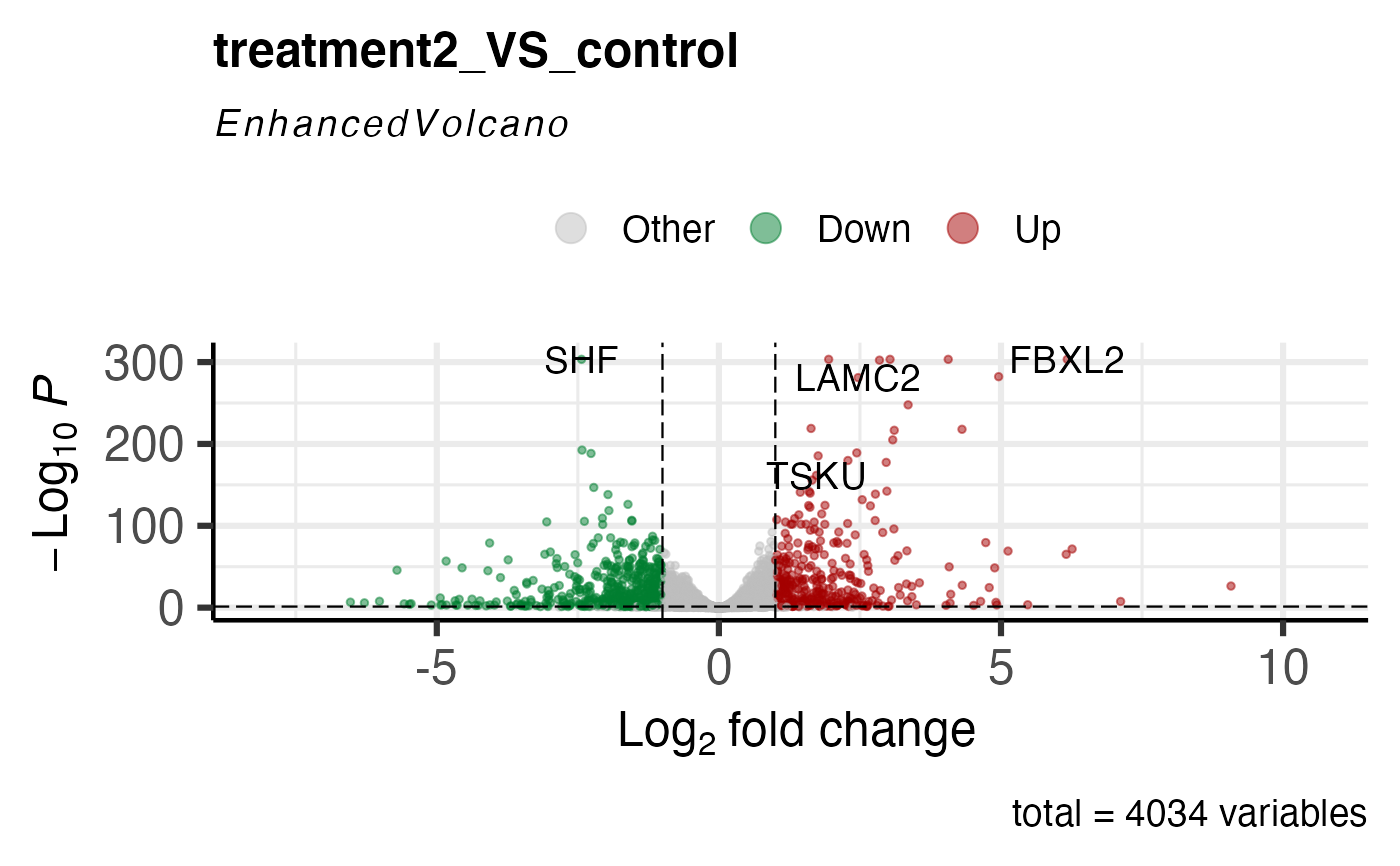
 get_volcano_plot(res, sample_comparison = res$de_comparisons[2] , genes_to_display = c("THEG","FBXL2","LAMC2","SHF","TSKU"), lab_size = 5) %>% print()
#> Warning: One or more p-values is 0. Converting to 10^-1 * current lowest non-zero p-value...
#> Warning: Ignoring unknown parameters: xlim, ylim
get_volcano_plot(res, sample_comparison = res$de_comparisons[2] , genes_to_display = c("THEG","FBXL2","LAMC2","SHF","TSKU"), lab_size = 5) %>% print()
#> Warning: One or more p-values is 0. Converting to 10^-1 * current lowest non-zero p-value...
#> Warning: Ignoring unknown parameters: xlim, ylim