Generate a venn diagram showing overlap between DE genes.
Arguments
- x
an abject of class
parcutils. This is an output of the functionrun_deseq_analysis().- sample_comparisons
a character vector of length 2 denoting DE comparisons for which venn diagram to plot.
- regulation
a character string from
up, down, both. Ifupordownrespective gene sets from thesample_comparisonswill be used for venn diagram. Ifboth, bothupanddownwill be from eachsample_comparisonswill be used for venn diagram.- fill_color
an argument pass to the function ggvenn::ggvenn.
- ...
other arguments pass to the function ggvenn::ggvenn
Examples
x <- parcutils:::.get_parcutils_object_example()
#> ℹ Running DESeq2 ...
#> converting counts to integer mode
#> Warning: some variables in design formula are characters, converting to factors
#> estimating size factors
#> estimating dispersions
#> gene-wise dispersion estimates
#> mean-dispersion relationship
#> final dispersion estimates
#> fitting model and testing
#> ✔ Done.
#> ℹ Summarizing DEG ...
#> ✔ Done.
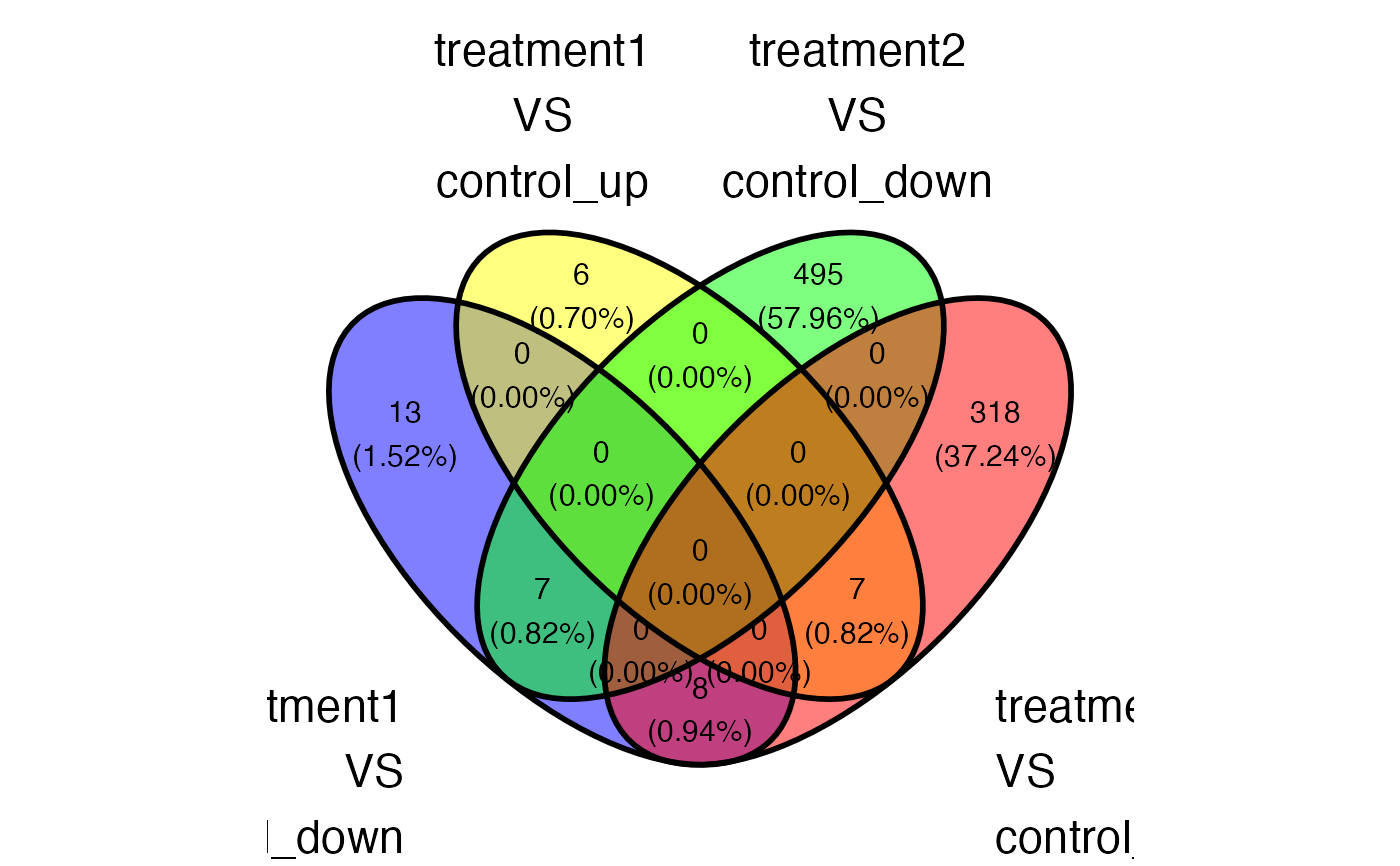
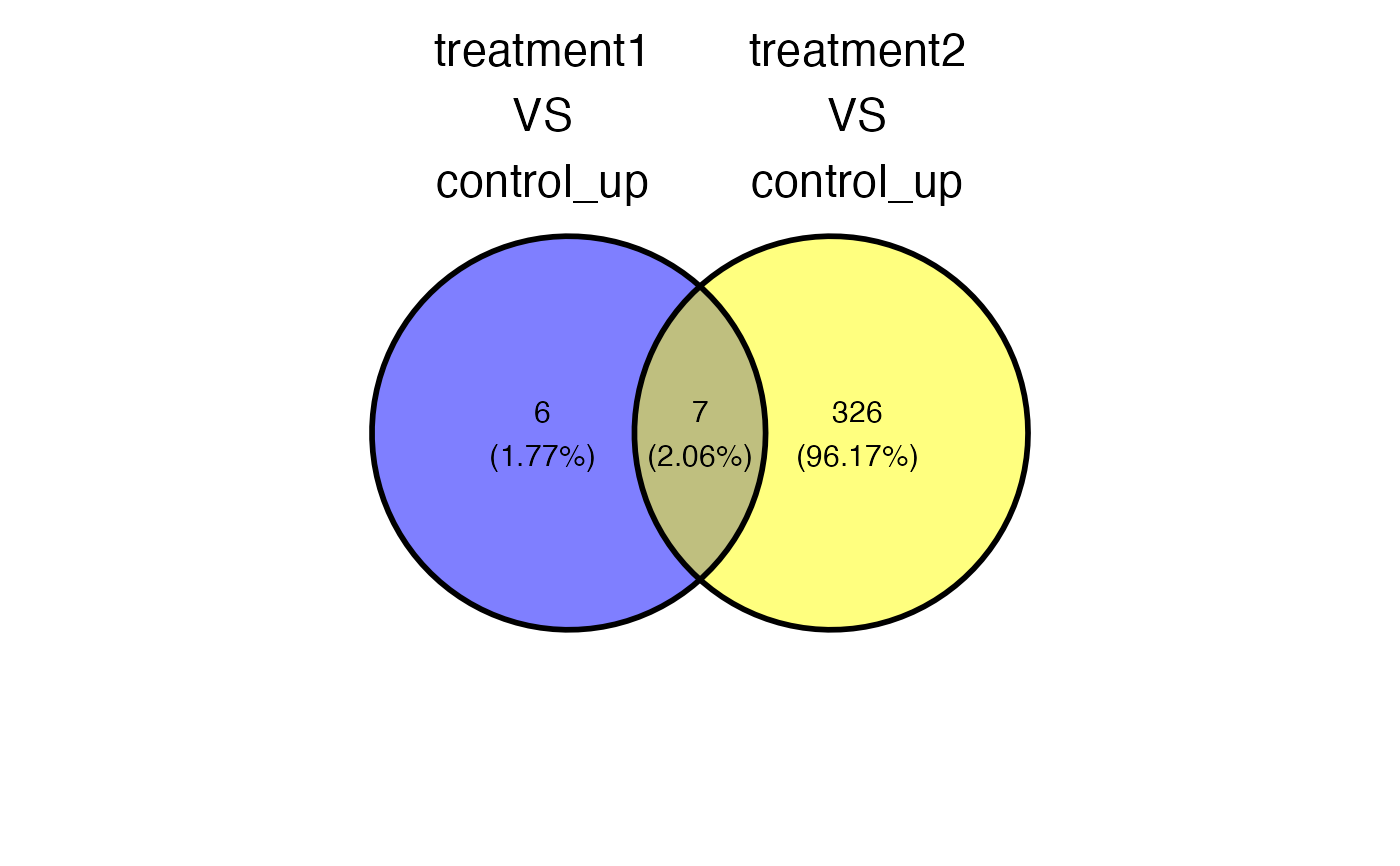
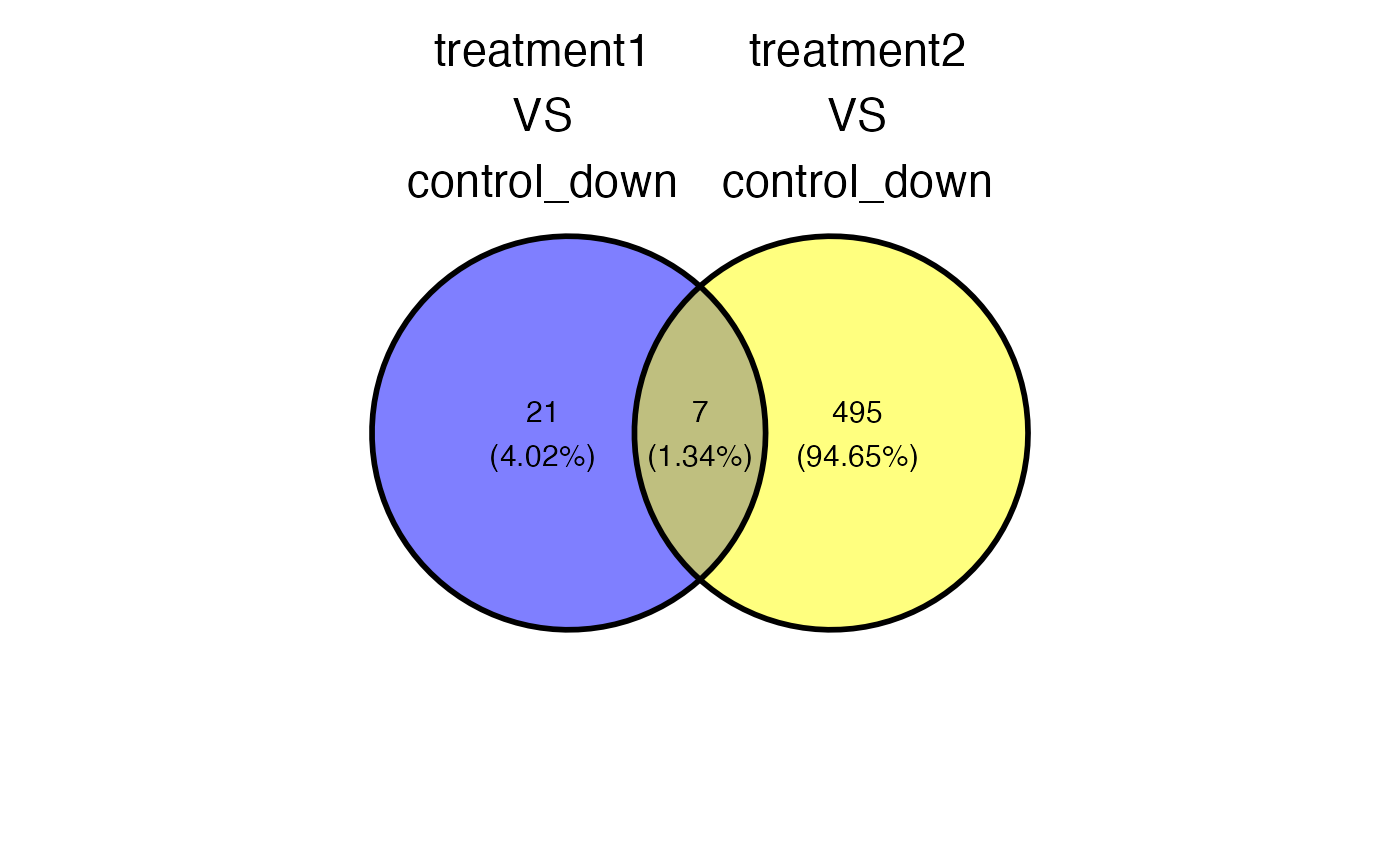
sample_comparisons <- c("treatment1_VS_control","treatment2_VS_control")
plot_deg_venn(x = x, sample_comparisons = sample_comparisons , regulation = "up")
 plot_deg_venn(x = x, sample_comparisons = sample_comparisons , regulation = "down")
 plot_deg_venn(x = x, sample_comparisons = sample_comparisons , regulation = "both")