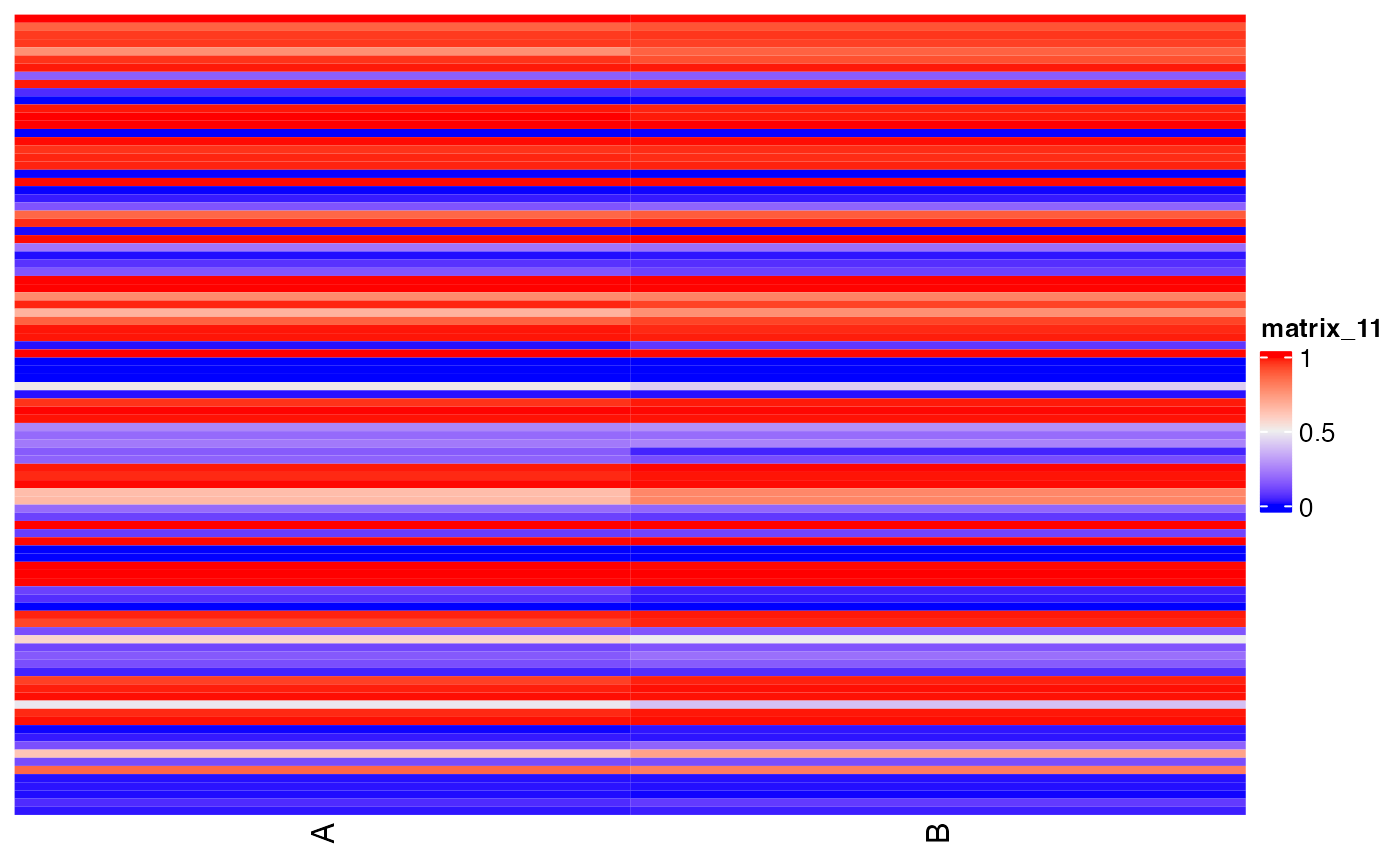
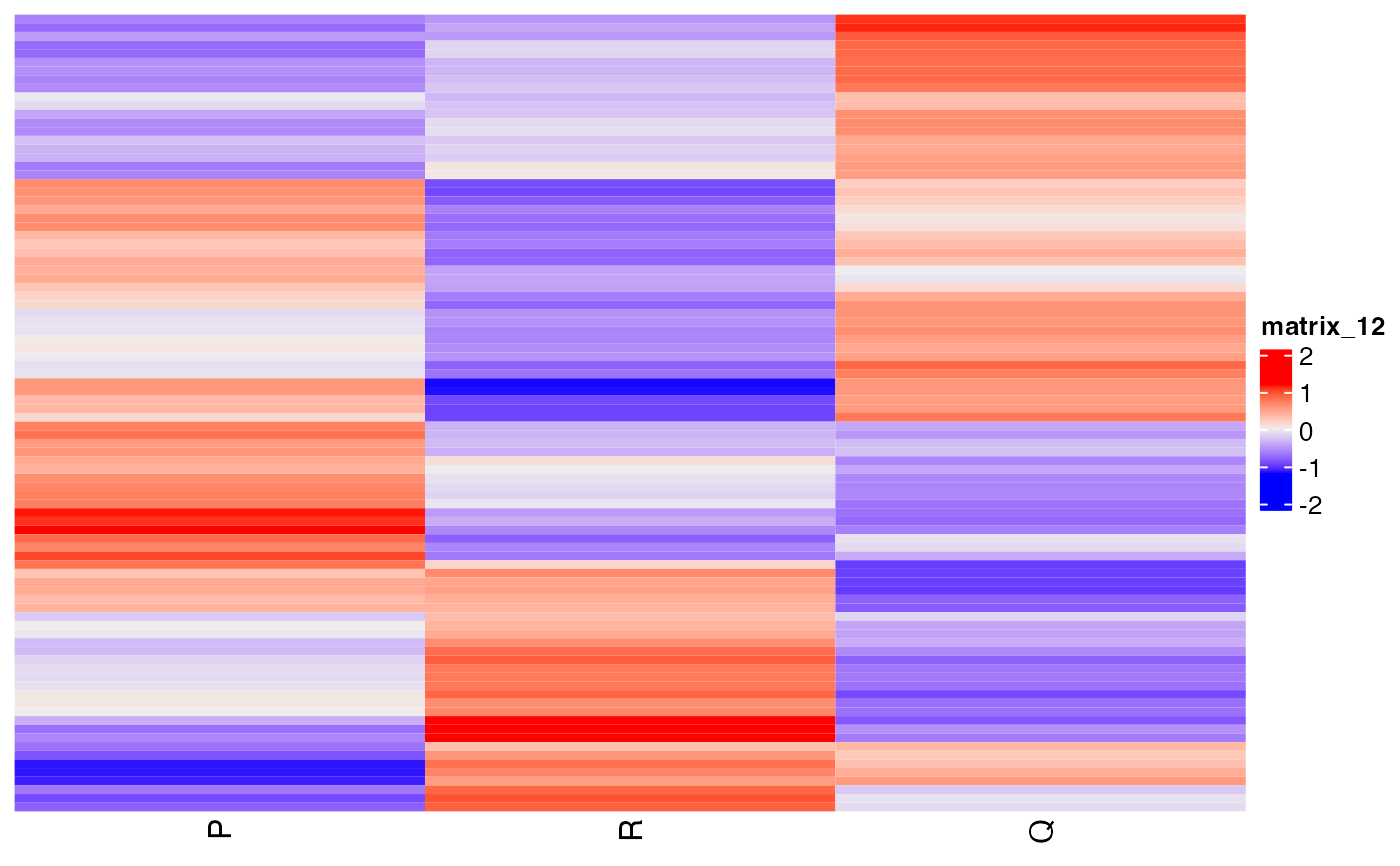
Generate a heatmap for a given list of ASE.
Source:R/splicewiz_wrappers.R
get_ase_data_matrix_heatmap.RdGenerate a heatmap for a given list of ASE.
Usage
get_ase_data_matrix_heatmap(
  se,
  event_names,
  samples,
  column_condition = "condition",
  method = "PSI",
  summarise_groups = TRUE,
  summarise_groups_by = "mean",
  show_row_names = FALSE,
  cluster_rows = FALSE,
  cluster_columns = FALSE,
  show_column_dend = FALSE,
  show_row_dend = FALSE,
  ...
)
Arguments
- se
an object of class NxtSE.
- event_names
a character vector denoting valid spliceWiz event names.
- samples
a character vector denoting valid sample names.
- column_condition
a name of column in se storing condition. Deafault: "condition".
- method
one of the character strings: "Z-score", "PSI" ,"logit".
- summarise_groups
pass to
summarise_groupsofget_ASE_data_matrix().- summarise_groups_by
pass to
summarise_groups_byofget_ASE_data_matrix().- show_row_names
logical, whether to show row names in the heatmap.
- cluster_rows
logical, whether to clusters rows in the heatmap.
- cluster_columns
logical, whether to cluster column in the heatmap or not.
- show_column_dend
logical, whether to show column dendrogram in the heatmap or not.
- show_row_dend
logical, whether to show row dendrogram in the heatmap or not.
- ...
other parameters to pass
ComplexHeatmap::Heatmap()
Examples
se <- SpliceWiz::SpliceWiz_example_NxtSE(novelSplicing = TRUE)
SpliceWiz::colData(se)$treatment <- rep(c("A", "B"), each = 3)
SpliceWiz::colData(se)$replicate <- rep(c("P","Q","R"), 2)
res <- run_ase_diff_analysis(x = se, test_factor = "treatment", test_nom = "A" ,test_denom = "B",  IRmode ="annotated",  cutoff_lfc = 0.6, cutoff_padj = 1, regul_based_upon = 2)
#> Mar 18 15:09:50 Performing edgeR contrast for included / excluded counts separately
#> Mar 18 15:09:52 Performing edgeR contrast for included / excluded counts together
event_names = get_ASEsets_by_regulation(x = res, sample_comparisons = "A_VS_B", regul = "all") %>% unlist()

get_ase_data_matrix_heatmap(se, event_names = event_names, samples = c("A" ,"B"), column_condition = "treatment", summarise_groups = FALSE )
#> Error in get_ASE_data_matrix(se = se, event_names = event_names, summarise_groups = summarise_groups,     summarise_groups_by = summarise_groups_by, column_condition = column_condition,     samples = samples, method = method): isTRUE(summarise_groups) is not TRUE
get_ase_data_matrix_heatmap(se, event_names = event_names, samples = c("A" ,"B"), column_condition    = "treatment", summarise_groups = TRUE )
#> Warning: The input is a data frame-like object, convert it to a matrix.

get_ase_data_matrix_heatmap(se, event_names = event_names, samples = c("P" ,"R","Q"), column_condition    = "replicate",method = "Z-score", cluster_rows = TRUE)
#> Warning: The input is a data frame-like object, convert it to a matrix.

get_ASE_data_matrix(se, event_names , samples = c("A", "B"), column_condition ="treatment")
#> # A tibble: 98 × 3
#>    event_name                                       A      B
#>    <chr>                                        <dbl>  <dbl>
#>  1 A3SS:NSUN5-201-exon3;NSUN5-203-exon3        1      0.996
#>  2 A3SS:NSUN5-201-exon7;NSUN5-206-exon6        0.879  0.908
#>  3 A3SS:NSUN5-201-exon8;NSUN5-novelTr003-exon2 0.953  0.958
#>  4 A3SS:NSUN5-204-exon10;NSUN5-202-exon10      0.955  0.941
#>  5 A3SS:SRSF1-201-exon4;SRSF1-novelTr001-exon2 0.766  0.877
#>  6 A3SS:SRSF1-204-exon4;SRSF1-203-exon2        0.963  0.916
#>  7 A3SS:SRSF2-202-exon2;SRSF2-201-exon2        0.988  0.989
#>  8 A3SS:SRSF2-206-exon2;SRSF2-202-exon3        0.165  0.159
#>  9 A3SS:SRSF2-206-exon2;SRSF2-novelTr003-exon2 0.988  0.981
#> 10 A3SS:SRSF2-novelTr002-exon2;SRSF2-209-exon2 0.0530 0.0596
#> # … with 88 more rows