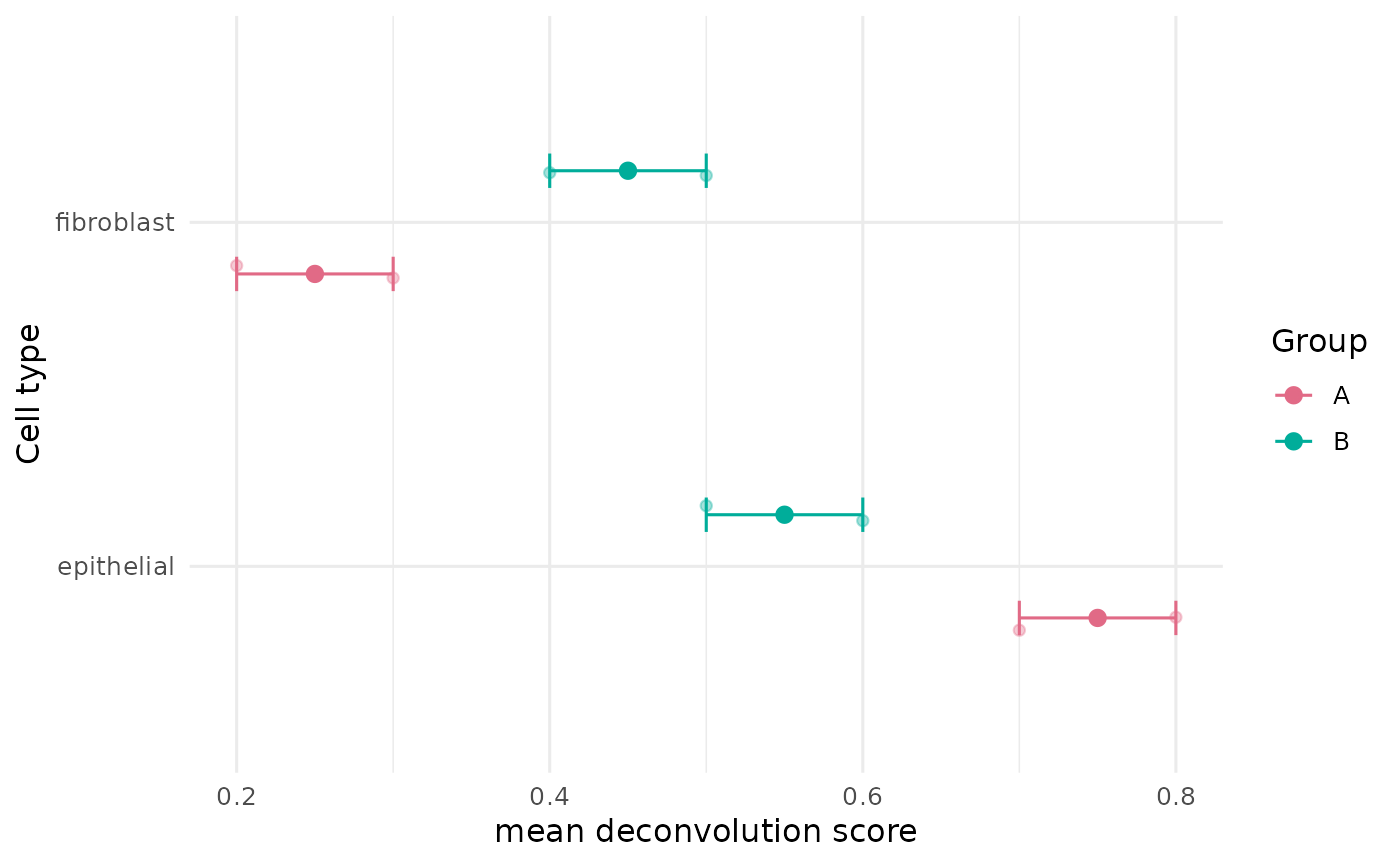
Plot group-level deconvolution scores as dot plot
Arguments
- x
A VISTA object.
- group_column
Column in
sample_info(x)that defines groups. IfNULL, uses the active VISTA group column when available.- cell_types
Optional character vector of cell types to include.
- top_n
Number of top cell types by mean score when
cell_typesisNULL.- summary_fun
One of
"mean"or"median"for group summary.- error
Error-bar type:
"se","sd", or"none".- add_points
Logical; overlay sample-level jittered points.
- point_size
Point size for summary points.
- base_size
Base font size.
Examples
mat <- matrix(rpois(20, lambda = 20), nrow = 5)
rownames(mat) <- paste0("gene", seq_len(5))
colnames(mat) <- paste0("sample", seq_len(4))
se <- SummarizedExperiment::SummarizedExperiment(
  assays = list(norm_counts = mat),
  colData = S4Vectors::DataFrame(
    cond = c("A", "A", "B", "B"),
    row.names = colnames(mat)
  ),
  rowData = S4Vectors::DataFrame(
    gene_id = rownames(mat),
    row.names = rownames(mat)
  )
)
v <- as_vista(se, group_column = "cond")
md <- S4Vectors::metadata(v)
md$cell_fractions <- data.frame(
  fibroblast = c(0.2, 0.3, 0.4, 0.5),
  epithelial = c(0.8, 0.7, 0.6, 0.5),
  row.names = colnames(mat)
)
S4Vectors::metadata(v) <- md
get_celltype_group_dotplot(v, group_column = "cond")