
Code Economy: VISTA vs. Standard R Workflows
VISTA Development Team
Source:vignettes/workflows/VISTA-code-economy.Rmd
VISTA-code-economy.RmdMotivation
A standard RNA-seq differential expression analysis – from raw counts to publication-ready figures and enrichment results – requires assembling many packages (11 in the version below), each with its own data structures, naming conventions, and implicit assumptions. The user is responsible for:
-
Data plumbing: converting between
DESeqDataSet,DGEList, data frames, matrices, and tibbles at every interface boundary - Identifier management: gene IDs must be stripped, mapped, and re-mapped at each stage (DE, annotation, enrichment, visualisation)
- State tracking: cutoffs, method settings, comparison names, and color schemes are scattered across script variables with no structured persistence
- Visual consistency: colours, axis labels, and themes must be manually coordinated across dozens of ggplot2 calls
None of these steps involve scientific reasoning. They are engineering overhead. VISTA eliminates them.
This vignette makes that claim concrete: we perform the same analysis twice on the same data – once with standard packages, once with VISTA – and measure the difference.
How the code is counted. Every tally in this
vignette is computed when the vignette is built, from the source of its
own code chunks; none is typed by hand. A line is a line that
is neither blank nor a pure comment. A package is one that a
workflow attaches with library() or require()
or calls with pkg::. Packages that ship with R are not
counted, and library(VISTA) counts like any other
library() call. The data chunk below is shared by both
workflows and counted for neither; apart from the packages it attaches
(airway and org.Hs.eg.db), each workflow attaches what its own code
needs, so either runs on its own after that chunk. A step’s package
count is the packages it adds, so the steps sum to the workflow’s total.
The counting code is shown in the appendix.
Workflow A is written by hand for this comparison. Its figures are equivalent in kind to VISTA’s (a PCA plot, a volcano plot, a heatmap of the top 50 genes and a Hallmark enrichment plot, all from the same DESeq2 results), not identical in every default: point labels, colours and heatmap clustering, for example, differ.
Data
We use the airway dataset (Himes et al. 2014): 8 samples of human airway smooth muscle cells, 4 treated with dexamethasone, 4 untreated.
Workflow A: Standard Packages
The code below uses only established Bioconductor and CRAN packages – DESeq2, ggplot2, ggrepel, dplyr, tibble, clusterProfiler, msigdbr, AnnotationDbi, ComplexHeatmap, circlize, and forcats. This is representative of real analysis scripts found in published supplementary materials.
library(DESeq2)
library(ggplot2)
library(ggrepel)
library(dplyr)
library(tibble)
library(clusterProfiler)
library(msigdbr)
library(AnnotationDbi)
8 library calls before a single line of analysis.
Step 1: Differential Expression (Standard)
# Build DESeqDataSet
dds <- DESeqDataSetFromMatrix(
  countData = counts_matrix,
  colData   = sample_meta,
  design    = ~ treatment
)

# Filter low-count genes
keep <- rowSums(counts(dds) >= 10) >= 2
dds  <- dds[keep, ]

# Run DE pipeline
dds <- DESeq(dds)

# Extract results
res <- results(dds, contrast = c("treatment", "Dexamethasone", "Untreated"))
res_df <- as.data.frame(res) %>%
  rownames_to_column("gene_id") %>%
  mutate(
    regulation = case_when(
      log2FoldChange >=  1 & padj < 0.05 ~ "Up",
      log2FoldChange <= -1 & padj < 0.05 ~ "Down",
      TRUE ~ "Other"
    )
  )

# Get normalized counts for downstream plots
norm_mat <- counts(dds, normalized = TRUE)
19 lines. The user must know:
DESeqDataSetFromMatrix, formula syntax, manual filtering
logic, results() contrast specification, fold-change and
p-value cutoff application, and regulation classification.
Step 2: Gene Annotation (Standard)
# Map Ensembl IDs to gene symbols
gene_symbols <- mapIds(
  org.Hs.eg.db,
  keys    = res_df$gene_id,
  keytype = "ENSEMBL",
  column  = "SYMBOL",
  multiVals = "first"
)

res_df$SYMBOL <- gene_symbols[res_df$gene_id]
8 lines. The user must handle mapIds(),
know the correct keytype, and deal with multi-mapping.
Step 3: PCA Plot (Standard)
# Variance-stabilising transform
vsd <- vst(dds, blind = FALSE)

# Extract PCA data
pca_data <- plotPCA(vsd, intgroup = "treatment", returnData = TRUE)
pct_var  <- round(100 * attr(pca_data, "percentVar"))

# Build ggplot manually
ggplot(pca_data, aes(x = PC1, y = PC2, color = treatment)) +
  geom_point(size = 4) +
  labs(
    x = paste0("PC1 (", pct_var[1], "% variance)"),
    y = paste0("PC2 (", pct_var[2], "% variance)"),
    color = "Treatment"
  ) +
  scale_color_manual(values = c("Untreated" = "#4575B4", "Dexamethasone" = "#D73027")) +
  theme_minimal(base_size = 14)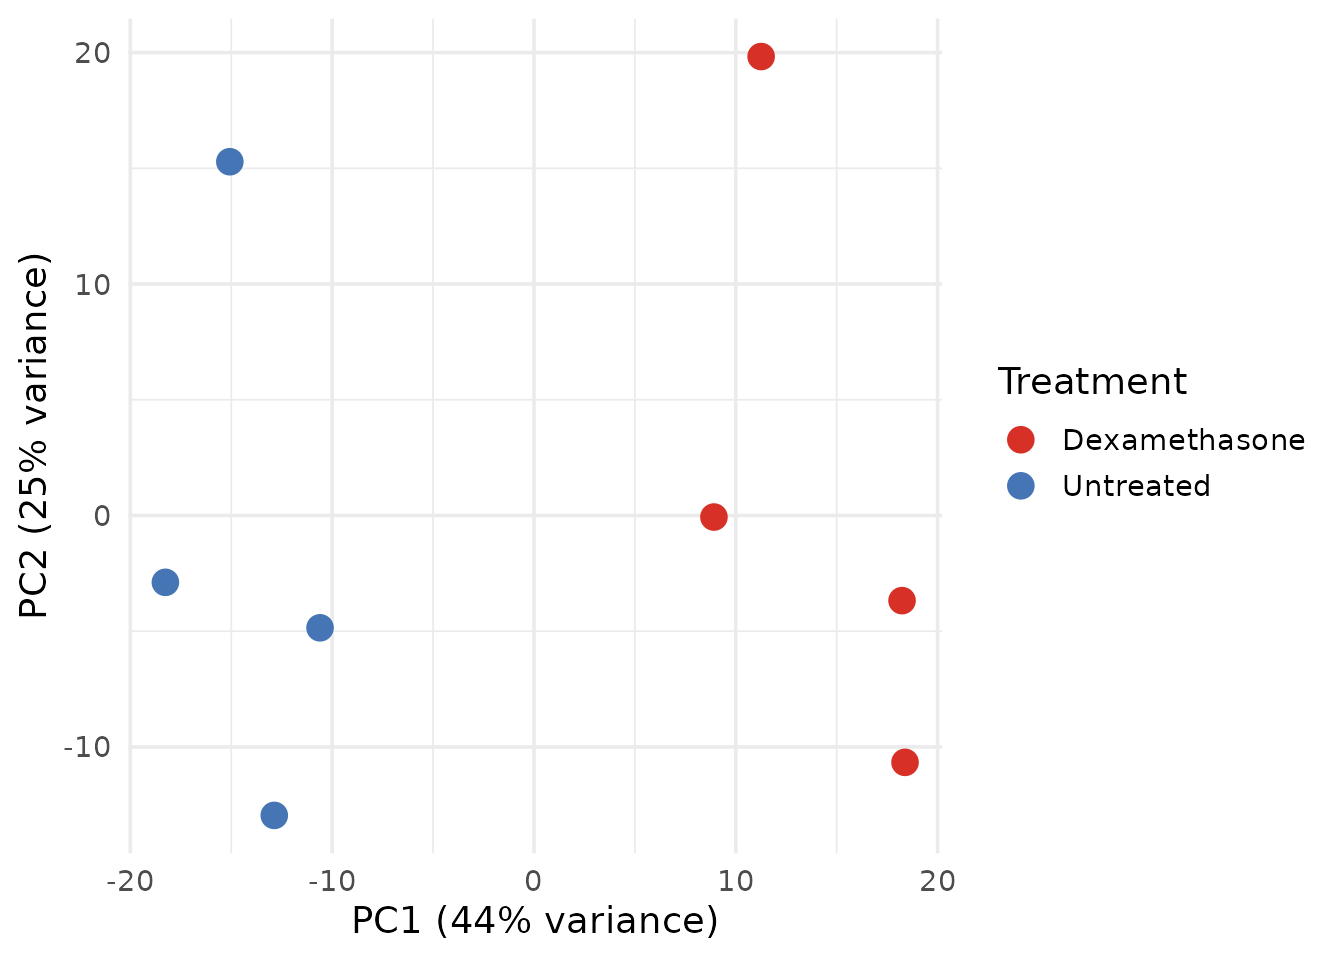
12 lines. The user must know: vst(),
plotPCA() with returnData, how to extract
percent variance from attributes, manual ggplot2 construction, and
hardcoded colour assignment.
Step 4: Volcano Plot (Standard)
volcano_df <- res_df %>%
  mutate(
    neg_log10_p = -log10(pvalue),
    label = ifelse(
      abs(log2FoldChange) > 2 & padj < 0.01 & !is.na(SYMBOL),
      SYMBOL, ""
    )
  )

ggplot(volcano_df, aes(x = log2FoldChange, y = neg_log10_p, color = regulation)) +
  geom_point(alpha = 0.6, size = 1.2) +
  geom_text_repel(aes(label = label), size = 3, max.overlaps = 15) +
  geom_vline(xintercept = c(-1, 1), linetype = "dashed", color = "grey50") +
  geom_hline(yintercept = -log10(0.05), linetype = "dashed", color = "grey50") +
  scale_color_manual(values = c(Up = "#D73027", Down = "#1A9850", Other = "grey70")) +
  labs(x = "log2 Fold Change", y = "-log10(p-value)", color = "Regulation") +
  theme_minimal(base_size = 14)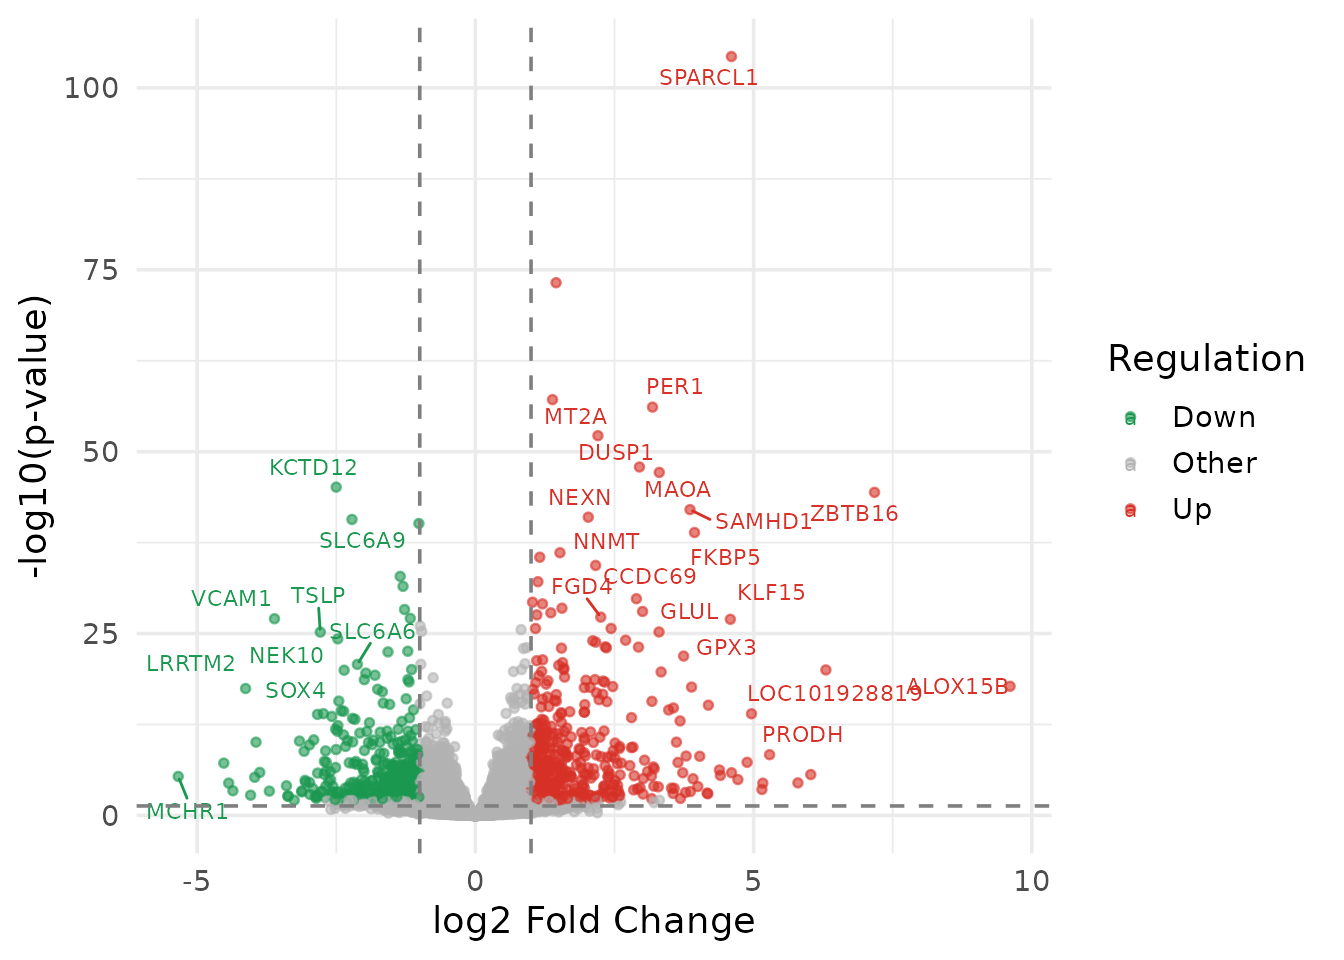
16 lines. Manual data preparation, manual label logic, manual threshold lines, manual colour mapping.
Step 5: Expression Heatmap (Standard)
library(ComplexHeatmap)
library(circlize)

# Select top DE genes
top_genes <- res_df %>%
  filter(regulation != "Other") %>%
  arrange(padj) %>%
  head(50) %>%
  pull(gene_id)

# Z-score transform
mat <- norm_mat[top_genes, ]
mat_z <- t(scale(t(log2(mat + 1))))

# Column annotation
col_ann <- HeatmapAnnotation(
  Treatment = sample_meta$treatment,
  col = list(Treatment = c("Untreated" = "#4575B4", "Dexamethasone" = "#D73027"))
)

# Map gene symbols for labels
row_labels <- ifelse(
  !is.na(gene_symbols[top_genes]),
  gene_symbols[top_genes],
  top_genes
)

Heatmap(
  mat_z,
  name = "Z-score",
  top_annotation = col_ann,
  row_labels = row_labels,
  show_row_names = TRUE,
  row_names_gp = gpar(fontsize = 7),
  column_names_gp = gpar(fontsize = 9),
  clustering_distance_rows = "euclidean",
  clustering_method_rows = "ward.D2"
)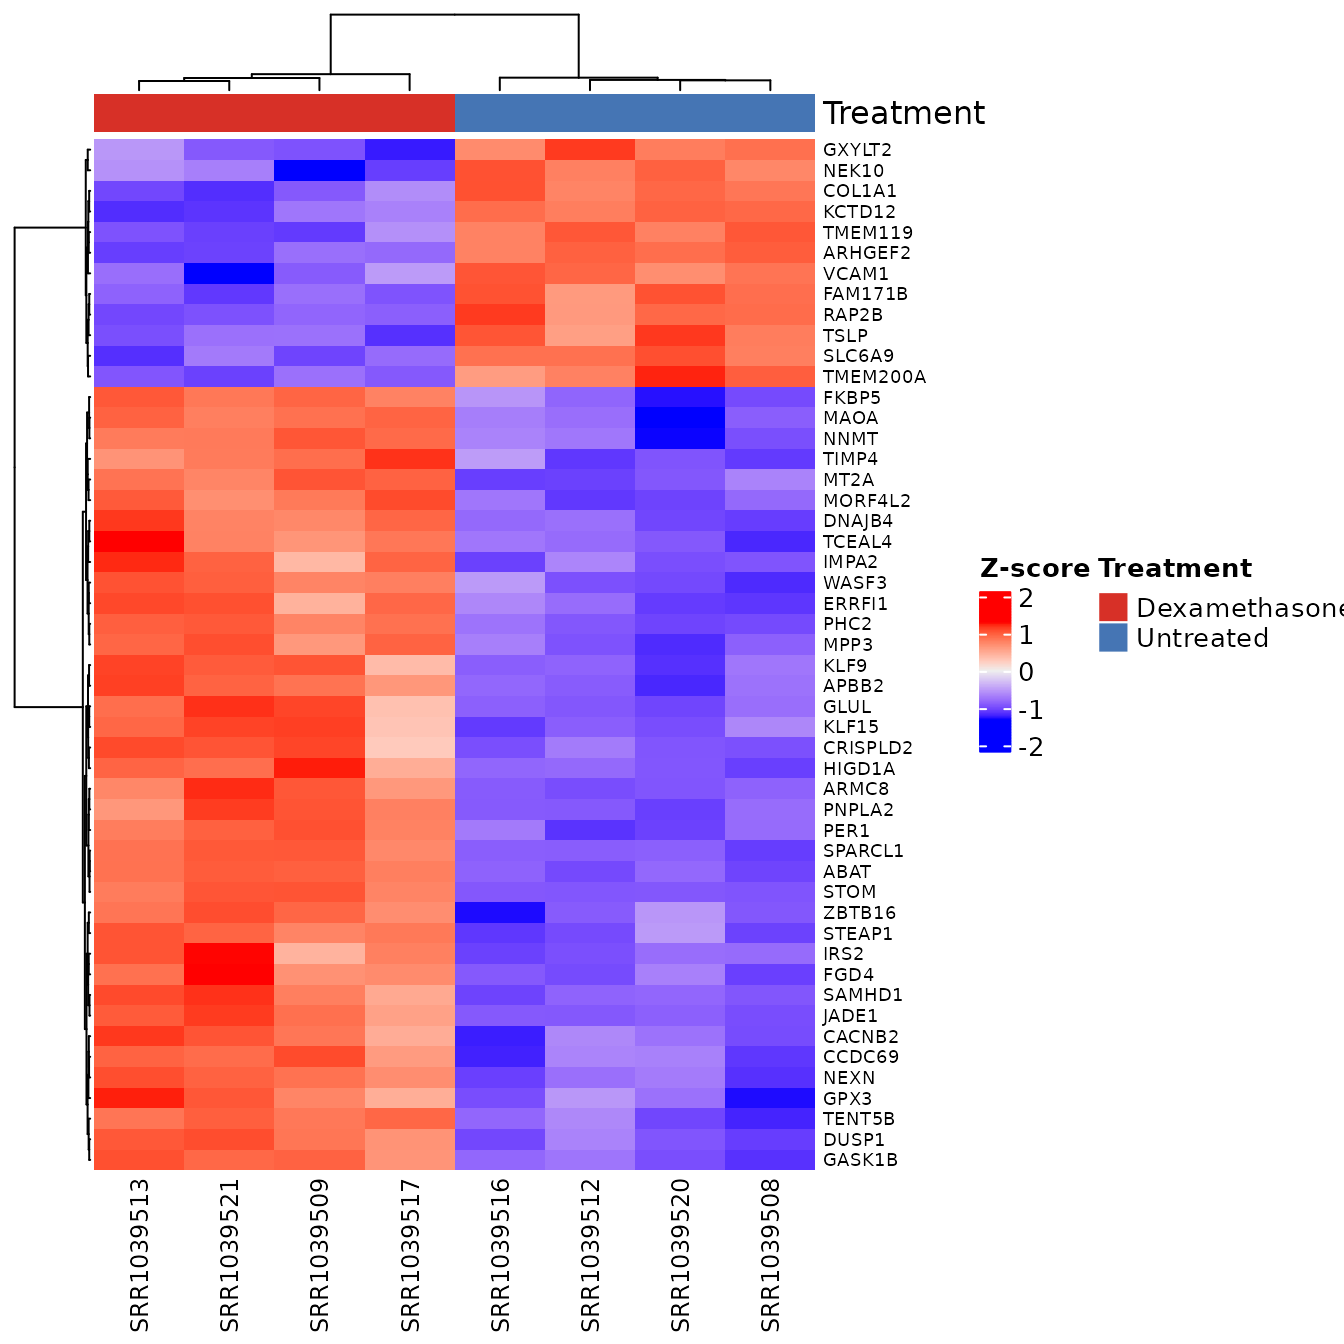
29 lines. The user must: load 2 more packages,
manually select top genes, compute z-scores, construct
HeatmapAnnotation with manually repeated colours, map gene
symbols for row labels, and configure Heatmap() with 8
named arguments.
Step 6: MSigDB Enrichment (Standard)
# Get upregulated gene symbols
up_genes <- res_df %>%
  filter(regulation == "Up", !is.na(SYMBOL)) %>%
  pull(SYMBOL) %>%
  unique()

# Fetch Hallmark gene sets
hallmark_sets <- msigdbr(species = "Homo sapiens", category = "H")
hallmark_t2g  <- hallmark_sets[, c("gs_name", "gene_symbol")]

# Run enrichment
enrich_result <- enricher(
  gene     = up_genes,
  TERM2GENE = hallmark_t2g,
  pvalueCutoff = 0.05,
  qvalueCutoff = 0.2
)
12 lines. The user must: filter and extract gene
symbols manually, know the msigdbr column names, construct the TERM2GENE
data frame, and call enricher() with correct
parameters.
Step 7: Enrichment Plot (Standard)
if (!is.null(enrich_result) && nrow(enrich_result@result) > 0) {
  enrich_df <- enrich_result@result %>%
    arrange(p.adjust) %>%
    head(10) %>%
    mutate(
      Description = forcats::fct_reorder(Description, -log10(p.adjust)),
      neg_log10_fdr = -log10(p.adjust)
    )

  ggplot(enrich_df, aes(x = neg_log10_fdr, y = Description)) +
    geom_point(aes(size = Count, color = neg_log10_fdr)) +
    scale_color_gradient(low = "blue", high = "red") +
    labs(x = "-log10(FDR)", y = NULL, size = "Gene Count") +
    theme_minimal(base_size = 13)
}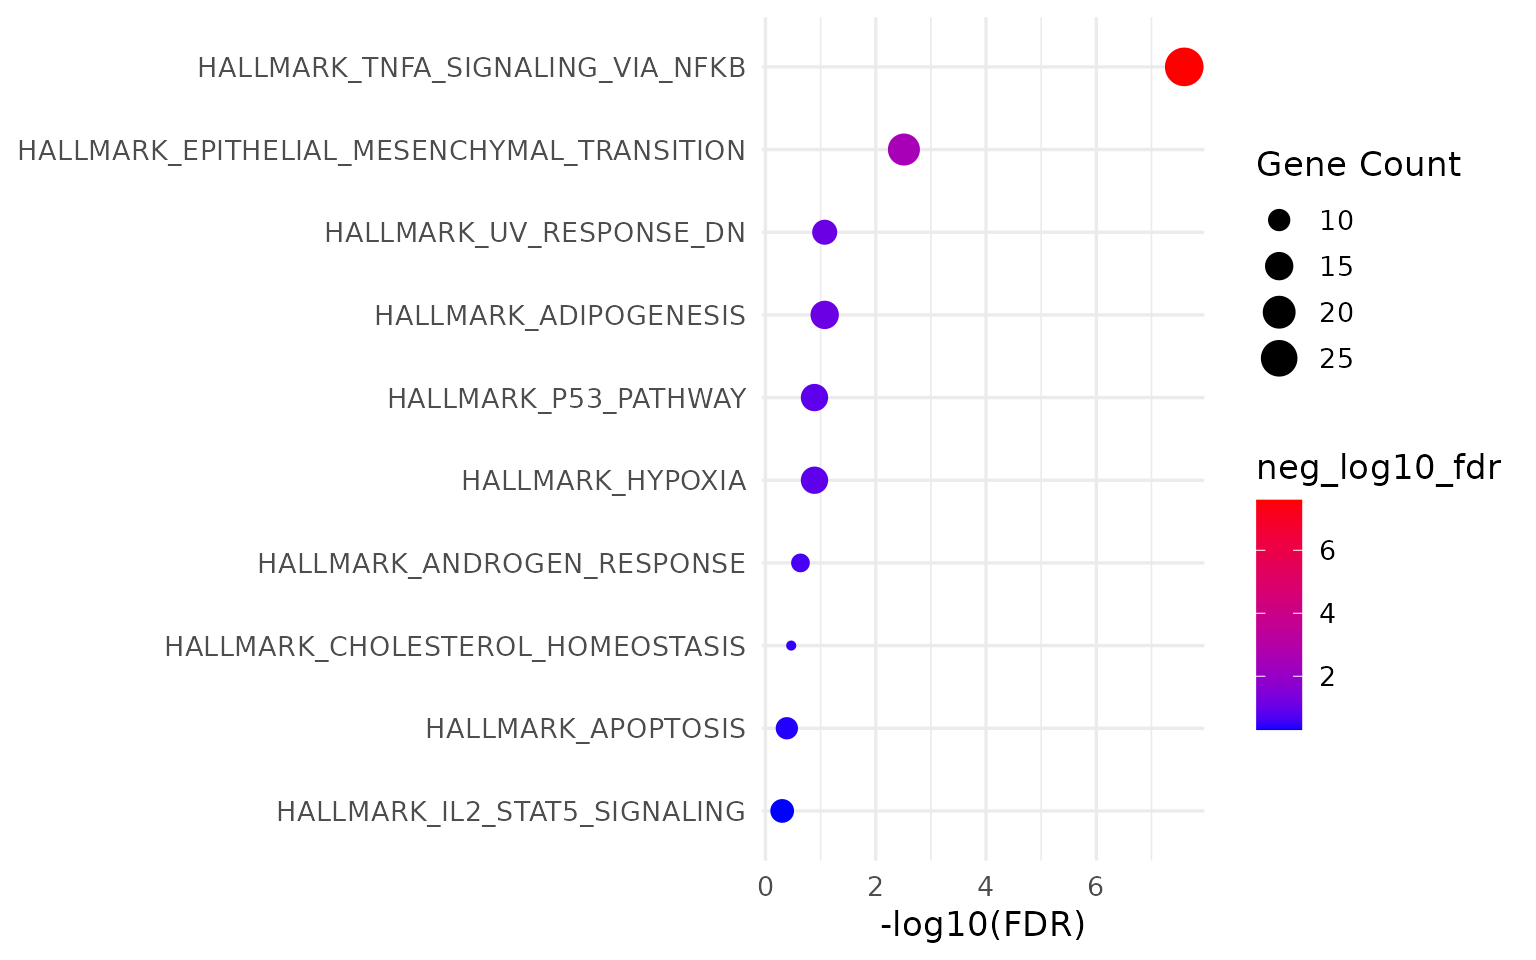
14 lines. Manual slot extraction, manual factor reordering, manual ggplot2 construction.
Standard Workflow: Summary
knitr::kable(
  standard_counts[, c("Step", "Lines", "Packages")],
  caption = paste0("Standard workflow: ", total_std, " lines, ", total_pkg, " packages"),
  align = c("l", "r", "r")
)| Step | Lines | Packages |
|---|---|---|
| Library calls | 8 | 8 |
| DE + annotation | 27 | 0 |
| PCA plot | 12 | 0 |
| Volcano plot | 16 | 0 |
| Expression heatmap | 29 | 2 |
| MSigDB enrichment | 12 | 0 |
| Enrichment plot | 14 | 1 |
Total: 118 lines of code, 11 packages used (DESeq2, ggplot2, ggrepel, dplyr, tibble, clusterProfiler, msigdbr, AnnotationDbi, ComplexHeatmap, circlize, and forcats).
Additional cognitive costs not captured in line count:
- Data structure conversions at each interface (matrix -> DESeqDataSet -> results -> data.frame -> filtered subset)
-
1 ID-mapping call (
mapIds()), whose symbols are then carried by hand into the volcano labels, the enrichment input and the heatmap row labels - 3 hand-typed colour vectors (PCA plot, Volcano plot, and Expression heatmap steps), kept consistent by hand
- No structured persistence (all state lives in script variables)
Workflow B: VISTA
The same analysis, same data, same kinds of output.
2 library calls. dplyr is attached here too because the next step reshapes the inputs with it; without it, this workflow would rely on Workflow A having attached it.
Steps 1–2: Differential Expression + Annotation
# Reshape the shared inputs into the tables create_vista() expects
count_data <- as.data.frame(counts_matrix) %>%
  tibble::as_tibble() %>%
  mutate(gene_id = rownames(counts_matrix)) %>%
  select(gene_id, everything())

sample_info <- sample_meta %>%
  tibble::as_tibble() %>%
  rename(sample_names = Run) %>%
  mutate(sample_names = as.character(sample_names))

# One call: DE + filtering + normalization + regulation classification
vista <- create_vista(
  counts            = count_data,
  sample_info       = sample_info,
  column_geneid     = "gene_id",
  group_column      = "treatment",
  group_numerator   = "Dexamethasone",
  group_denominator = "Untreated",
  method            = "deseq2",
  min_counts        = 10,
  min_replicates    = 2,
  log2fc_cutoff     = 1.0,
  pval_cutoff       = 0.05,
  p_value_type      = "padj"
)

# One call: gene annotation
vista <- set_rowdata(
  vista,
  orgdb   = org.Hs.eg.db,
  columns = c("SYMBOL", "GENENAME", "ENTREZID"),
  keytype = "ENSEMBL"
)
28 lines, including the reshaping of the shared
inputs that create_vista() needs.
create_vista() performed: count filtering, DESeq2
pipeline execution, normalized count extraction, fold-change/p-value
thresholding, regulation classification, colour palette assignment, and
metadata persistence – in one call. set_rowdata() handled
all ID mapping.
Step 3: PCA Plot
get_pca_plot(vista, label = TRUE)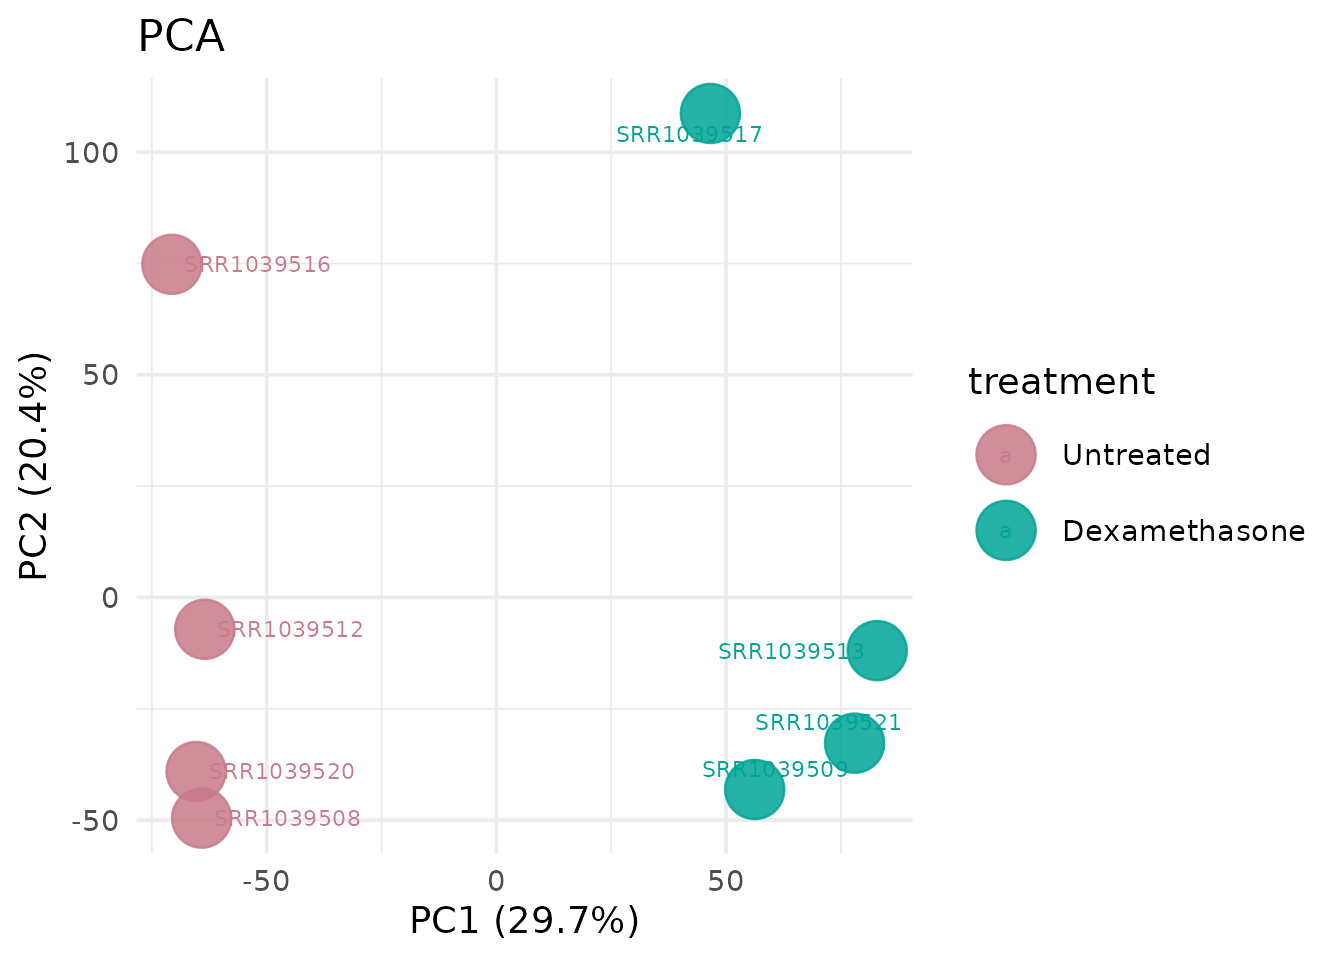
1 line. Colors are inherited from the VISTA object. Axis labels with variance percentages are generated automatically.
Step 4: Volcano Plot
get_volcano_plot(
  vista,
  sample_comparison = names(comparisons(vista))[1],
  display_id = "SYMBOL"
)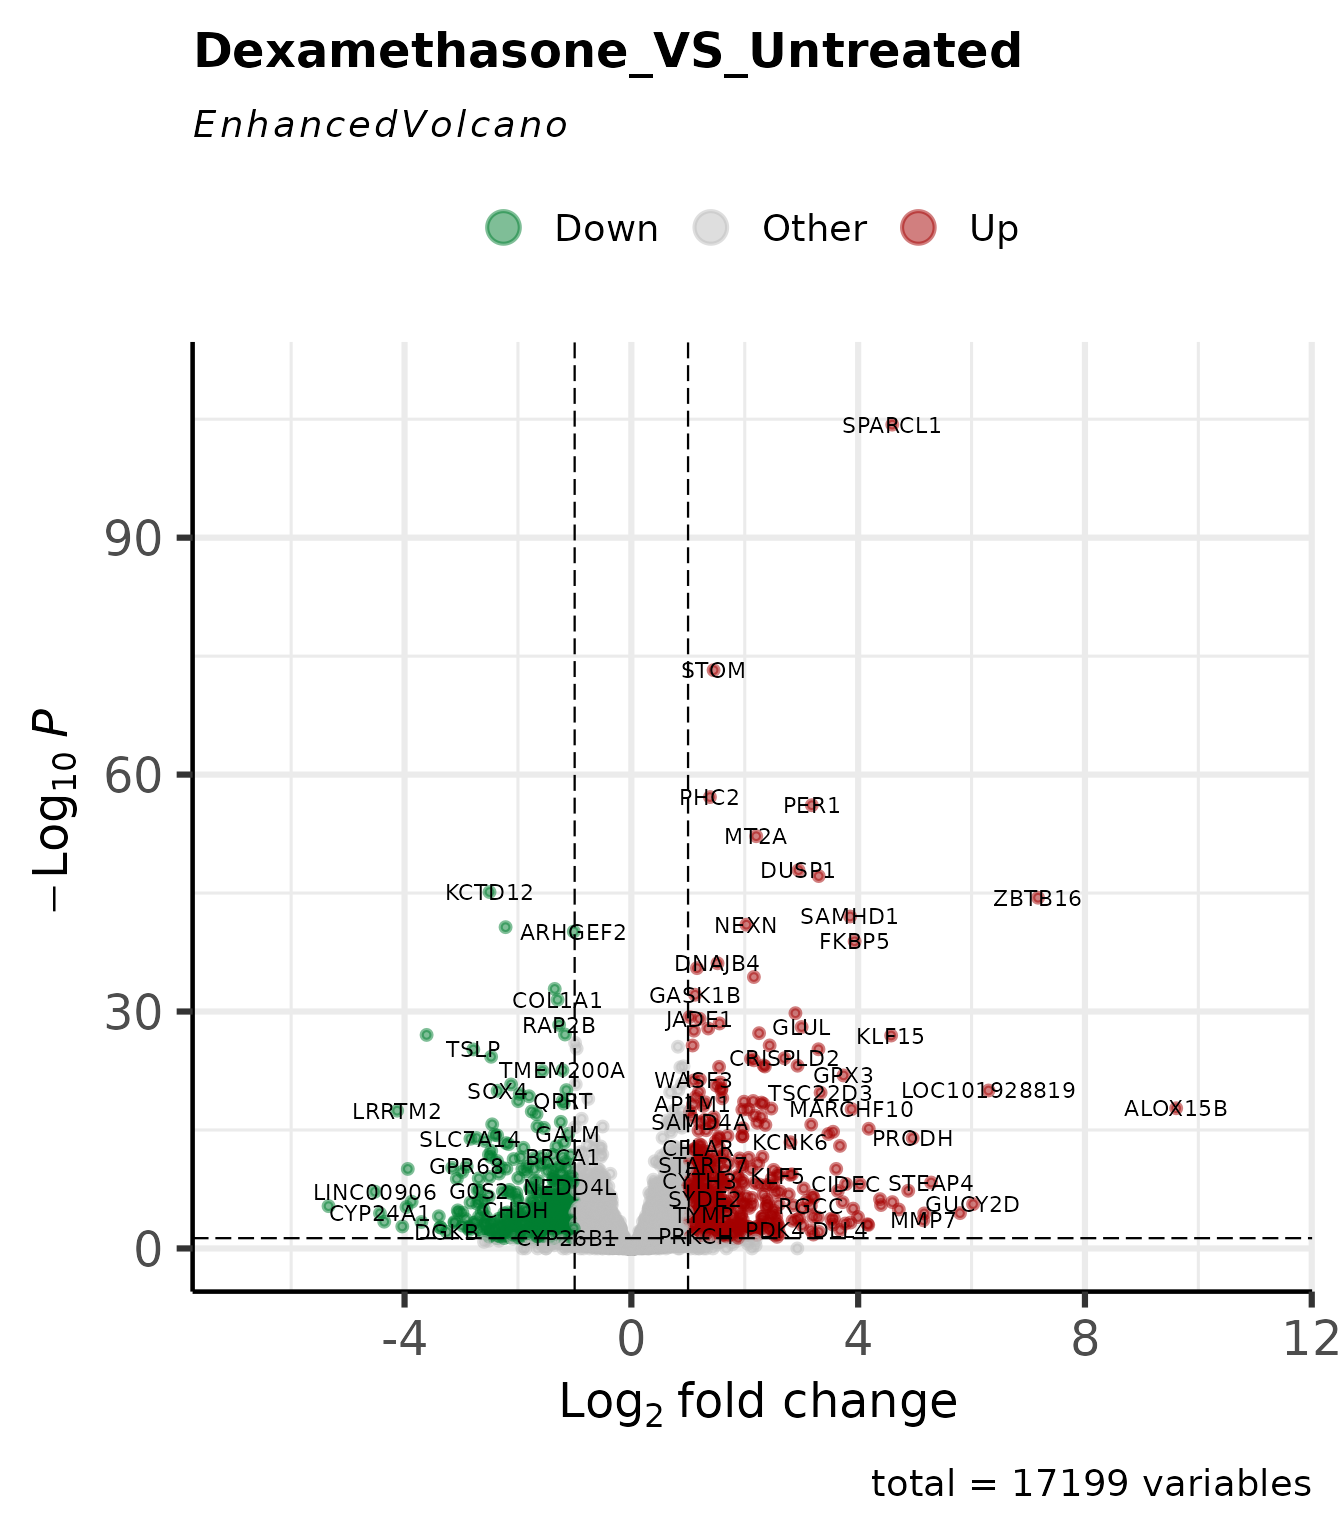
5 lines. Threshold lines, gene labels, and colour scheme are derived from the stored cutoffs and palette.
Step 5: Expression Heatmap
# Select top 50 DE genes using VISTA accessor
comp_name <- names(comparisons(vista))[1]
de_tbl    <- comparisons(vista)[[comp_name]]
top_genes <- head(de_tbl$gene_id[de_tbl$regulation != "Other"][
  order(de_tbl$padj[de_tbl$regulation != "Other"])
], 50)

get_expression_heatmap(
  x               = vista,
  sample_group    = c("Untreated", "Dexamethasone"),
  genes            = top_genes,
  value_transform  = "zscore",
  display_id       = "SYMBOL",
  annotate_columns = TRUE,
  show_row_names   = TRUE,
  summarise_replicates  = FALSE
)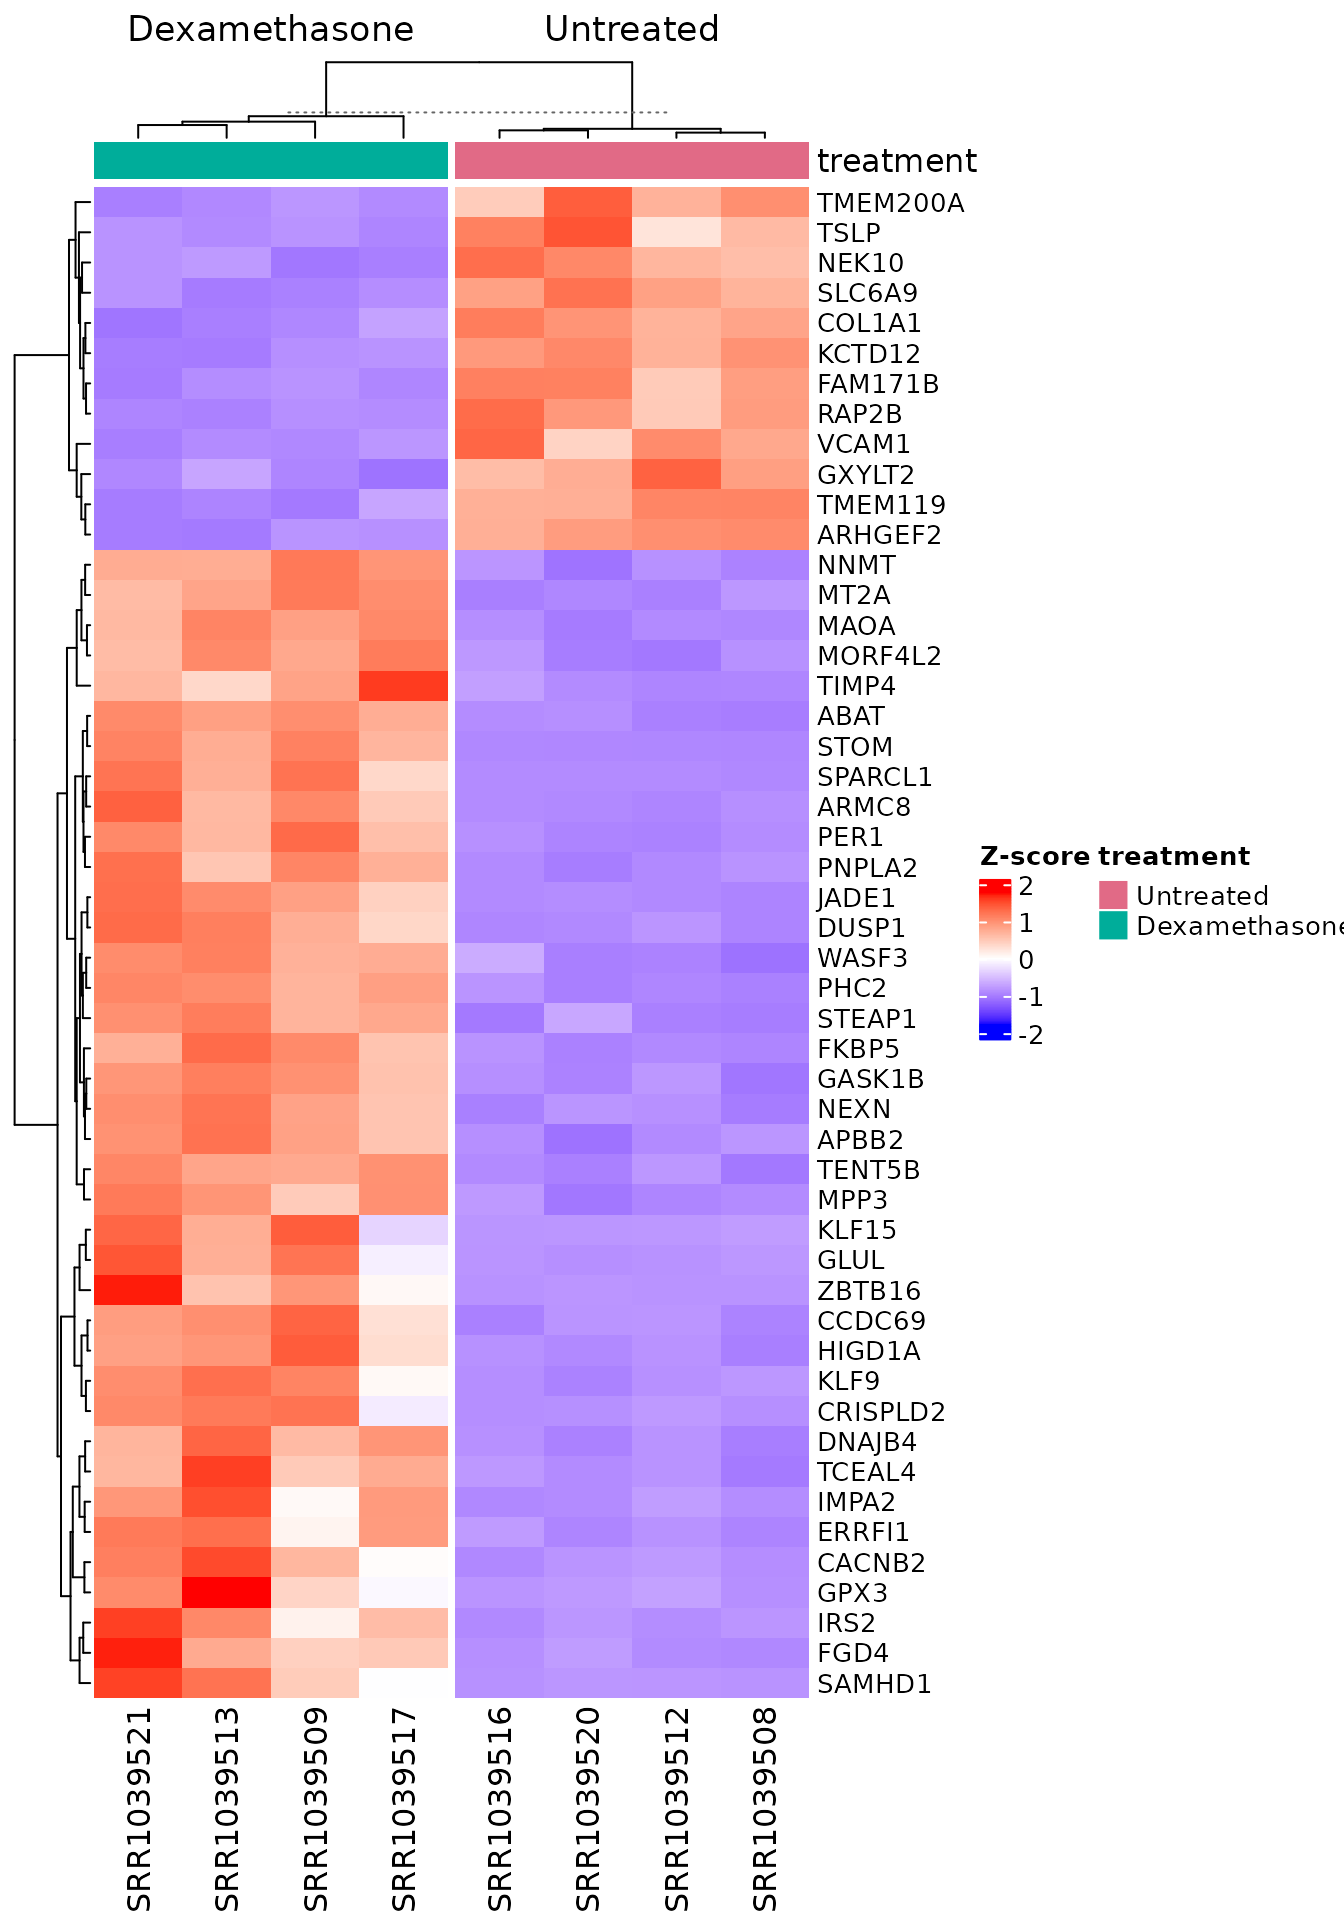
15 lines. Z-score transformation, column annotation with consistent colours, and symbol mapping are handled internally.
Step 6: MSigDB Enrichment
msig_up <- get_msigdb_enrichment(
  vista,
  sample_comparison = names(comparisons(vista))[1],
  regulation  = "Up",
  msigdb_category = "H",
  species     = "Homo sapiens",
  from_type   = "ENSEMBL"
)
8 lines. Gene extraction, ID conversion, TERM2GENE construction, and enrichment execution are handled internally.
Step 7: Enrichment Plot
if (!is.null(msig_up$enrich) && nrow(msig_up$enrich@result) > 0) {
  get_enrichment_plot(msig_up$enrich, top_n = 10)
}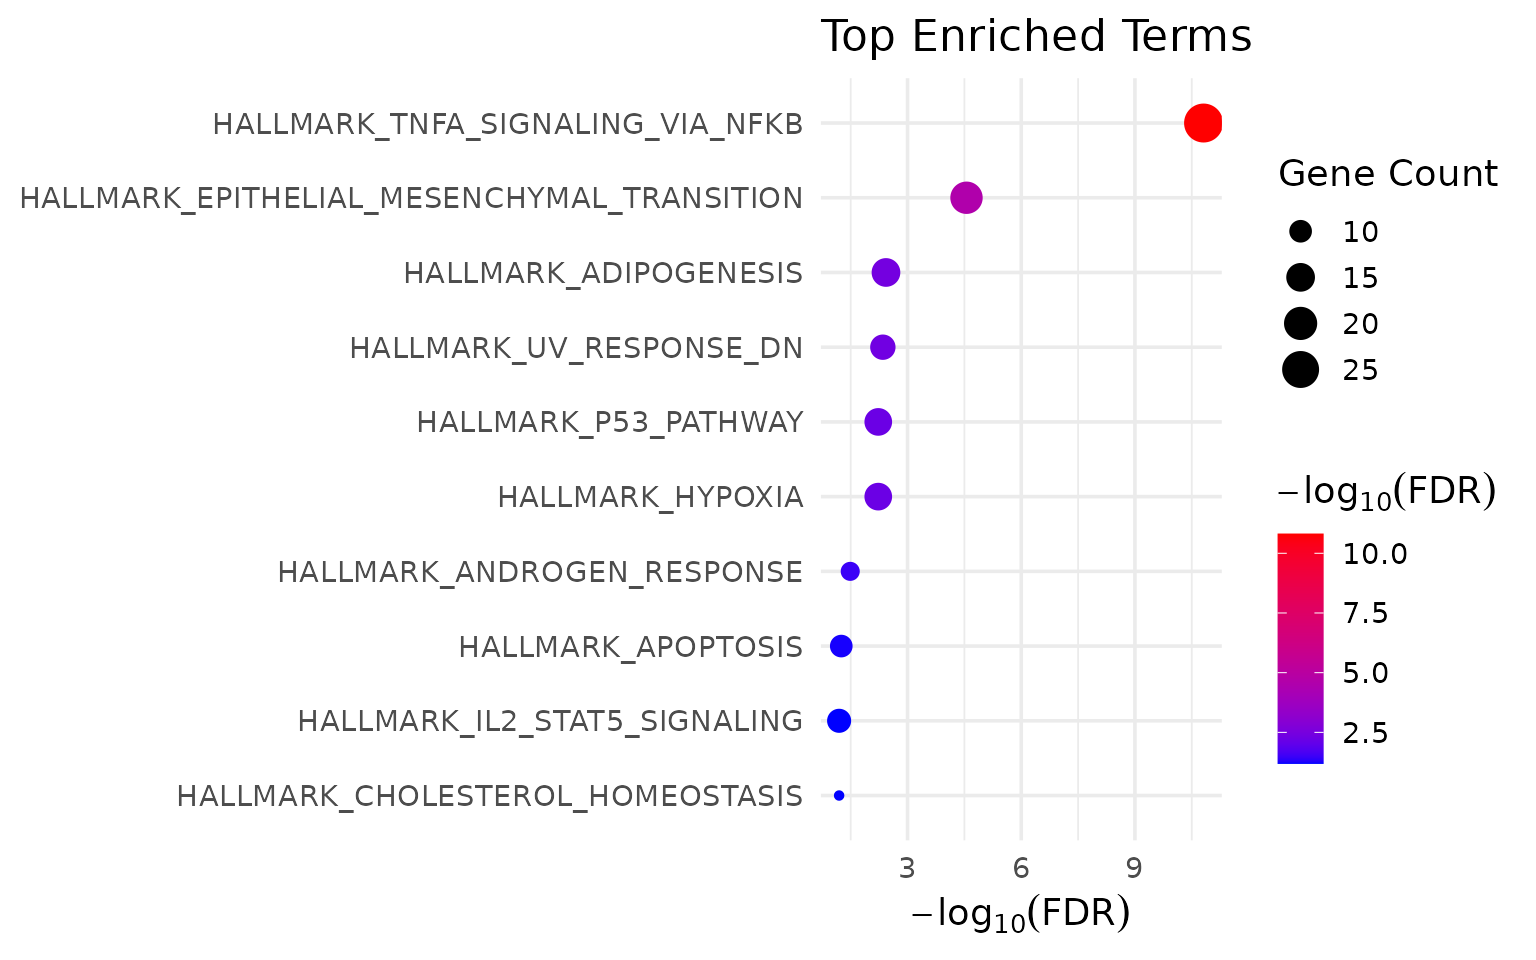
3 lines.
VISTA Workflow: Summary
knitr::kable(
  vista_counts[, c("Step", "Lines", "Packages")],
  caption = paste0("VISTA workflow: ", total_vista, " lines, ", n_of(total_pkg_vista, "package")),
  align = c("l", "r", "r")
)| Step | Lines | Packages |
|---|---|---|
| Library calls | 2 | 2 |
| DE + annotation | 28 | 1 |
| PCA plot | 1 | 0 |
| Volcano plot | 5 | 0 |
| Expression heatmap | 15 | 0 |
| MSigDB enrichment | 8 | 0 |
| Enrichment plot | 3 | 0 |
Total: 62 lines of code, 3 packages used (VISTA, dplyr, and tibble).
Side-by-Side Comparison
| Step | Standard (lines) | VISTA (lines) | Reduction |
|---|---|---|---|
| Library calls | 8 | 2 | 75% |
| DE + annotation | 27 | 28 | -4% |
| PCA plot | 12 | 1 | 92% |
| Volcano plot | 16 | 5 | 69% |
| Expression heatmap | 29 | 15 | 48% |
| MSigDB enrichment | 12 | 8 | 33% |
| Enrichment plot | 14 | 3 | 79% |
| Total | 118 | 62 | 47% |
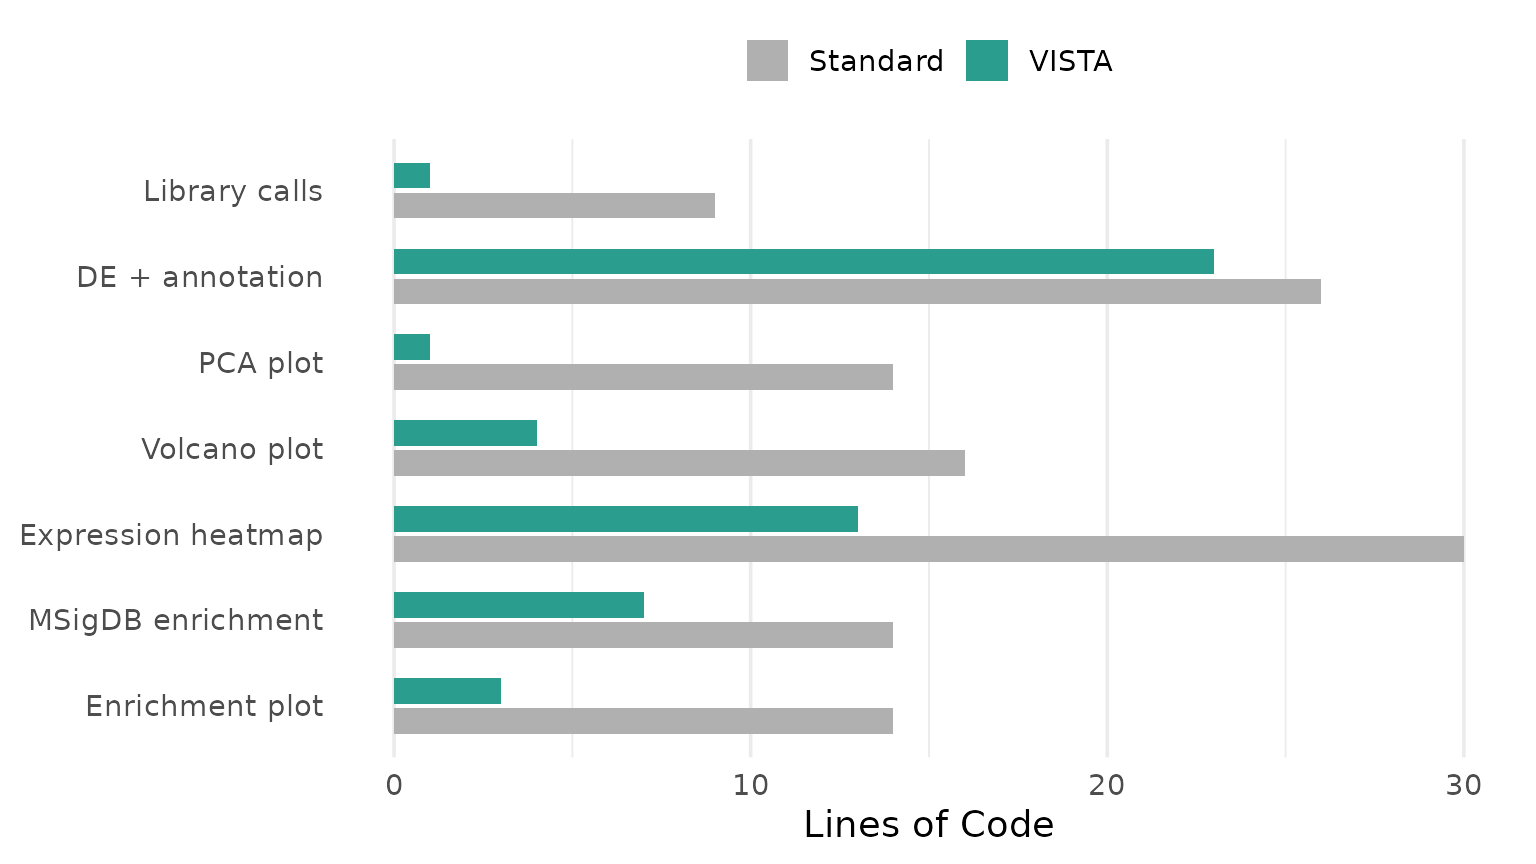
Overall, Workflow B is 47% shorter than Workflow A (62 lines against
118) and uses 3 packages against 11. The saving is not uniform: in the
DE + annotation step VISTA needs 28 lines against 27, because the inputs
must be reshaped for create_vista() and its settings are
passed as named arguments. Most of the saving is in the plotting and
enrichment steps.
Beyond Line Count
Line count is a proxy. The deeper value is in what the user does not have to think about:
Data structure conversions
| Standard workflow | VISTA |
|---|---|
matrix -> DESeqDataSet
|
matrix and sample table -> tibbles, once, as
create_vista() input |
DESeqResults -> data.frame |
Stored in metadata |
| data.frame -> filtered tibble | Accessor: comparisons(), then subset by hand for the
heatmap genes |
| matrix -> z-score matrix | value_transform = "zscore" |
| tibble -> gene vector for enrichment | Handled by get_msigdb_enrichment()
|
These are not counted, because what counts as a conversion is a
matter of judgement. Neither workflow is free of them: VISTA’s inputs
are reshaped once before create_vista(), and after that,
results are read through comparisons() and the VISTA
plotting and enrichment functions.
Identifier mappings
| Standard workflow | VISTA |
|---|---|
mapIds(org.Hs.eg.db, keys, "ENSEMBL", "SYMBOL") |
set_rowdata(orgdb, keytype) (once) |
| Manual symbol extraction for enrichment |
from_type = "ENSEMBL" (auto-converted) |
| Manual symbol lookup for plot labels |
display_id = "SYMBOL" (every plot) |
ID-mapping calls: 1 in Workflow A (mapIds()), 1
in Workflow B (set_rowdata()). Both map
identifiers once. The difference is what follows: Workflow A carries the
symbols by hand into the volcano labels, the enrichment input and the
heatmap row labels, while VISTA’s functions take the identifier type as
a parameter.
Color consistency: guaranteed vs. manual
In the standard workflow, the user defines colours in each plot:
# PCA: manually set
scale_color_manual(values = c("Untreated" = "#4575B4", "Dexamethasone" = "#D73027"))

# Heatmap: manually set (must match PCA)
col = list(Treatment = c("Untreated" = "#4575B4", "Dexamethasone" = "#D73027"))

# Volcano: different variable, different palette entirely
scale_color_manual(values = c(Up = "#D73027", Down = "#1A9850", Other = "grey70"))
If any of these diverge, figures become inconsistent. In VISTA, group colours are set once at object creation and propagated to every downstream plot automatically.
Counted over all its steps, Workflow A’s code types 3 colour vectors and 11 colour values by hand (hex codes and R colour names, including the threshold lines and the enrichment gradient); Workflow B’s types 0 colour vectors and 0 colour values.
State persistence: object vs. variables
# Standard: state is scattered
dds            # DESeqDataSet
res            # DESeqResults
res_df         # data.frame with regulation column
norm_mat       # normalized counts matrix
gene_symbols   # named character vector
vsd            # variance-stabilised transform
Six separate variables. If the script is interrupted and restarted, the user must re-run everything from the top.
# VISTA: state is in one object
vista          # everything
One object. saveRDS(vista, "analysis.rds") preserves the
full analysis state. Any plot or enrichment can be reproduced from this
object alone.
Summary
| Metric | Standard | VISTA |
|---|---|---|
| Total lines of code | 118 | 62 |
| Packages used | 11 | 3 |
| ID-mapping calls | 1 (mapIds()) |
1 (set_rowdata()) |
| Hand-typed colour vectors | 3 | 0 |
| Persistent analysis objects | 0 (scripts) | 1 (S4) |
VISTA does not introduce new statistical methods:
create_vista() runs DESeq2, edgeR or limma-voom rather than
reimplementing them. The check below compares the DESeq2 results of the
two workflows above gene by gene, counting for each column the genes
whose values are not exactly equal (a missing value matches only a
missing value).
vista_de <- comparisons(vista)[[1]]
std_de   <- as.data.frame(res)[vista_de$gene_id, ]
std_de$regulation <- res_df$regulation[match(vista_de$gene_id, res_df$gene_id)]
same_genes <- setequal(vista_de$gene_id, rownames(res)) &&
  nrow(vista_de) == nrow(res)

# VISTA column = standard column
de_columns <- c(baseMean = "baseMean", log2fc = "log2FoldChange",
                lfcSE = "lfcSE", stat = "stat", pvalue = "pvalue",
                padj = "padj", regulation = "regulation")
genes_differing <- vapply(names(de_columns), function(col) {
  a <- vista_de[[col]]
  b <- std_de[[de_columns[[col]]]]
  sum(xor(is.na(a), is.na(b)) | (!is.na(a) & !is.na(b) & a != b))
}, integer(1))

same_genes
#> [1] TRUE
genes_differing
#>   baseMean     log2fc      lfcSE       stat     pvalue       padj regulation
#>          0          0          0          0          0          0          0
On this data, the two workflows test the same 17199 genes and give identical results in every column compared.
What VISTA eliminates is the engineering overhead between these computations: the data reshaping, identifier juggling, colour coordination, and state management that take up scripting time without contributing to scientific reasoning.
Counting code
Every tally above is computed by this code, which reads the
vignette’s own chunks with knitr::knit_code$get().
# The counting rule behind every code tally in this vignette. This chunk is
# the rule's only copy: a script that reports these tallies elsewhere (such
# as the manuscript's count_code_economy.R) extracts this chunk from this
# file and runs it, so both count alike.

# The chunks that make up each step of each workflow. The shared
# `load-data` chunk is counted for neither workflow.
economy_steps <- list(
  Standard = list(
    "Library calls"      = "standard-packages",
    "DE + annotation"    = c("standard-de", "standard-annotation"),
    "PCA plot"           = "standard-pca",
    "Volcano plot"       = "standard-volcano",
    "Expression heatmap" = "standard-heatmap",
    "MSigDB enrichment"  = "standard-enrichment",
    "Enrichment plot"    = "standard-enrichment-plot"
  ),
  VISTA = list(
    "Library calls"      = "vista-packages",
    "DE + annotation"    = "vista-de",
    "PCA plot"           = "vista-pca",
    "Volcano plot"       = "vista-volcano",
    "Expression heatmap" = "vista-heatmap",
    "MSigDB enrichment"  = "vista-enrichment",
    "Enrichment plot"    = "vista-enrichment-plot"
  )
)

# Packages that ship with R itself are never counted.
base_r_pkgs <- c("base", "compiler", "datasets", "graphics", "grDevices",
                 "grid", "methods", "parallel", "splines", "stats",
                 "stats4", "tcltk", "tools", "utils")

# Calls that map gene identifiers. AnnotationDbi's select() is told apart
# from dplyr's select() by its `keytype` argument.
id_mapping_fns <- c("mapIds", "bitr", "set_rowdata")

# Lines: a line counts if it is not blank and not a pure comment.
count_lines <- function(code) {
  code <- trimws(code)
  sum(nzchar(code) & !startsWith(code, "#"))
}

# Every call in a piece of code, nested calls included.
code_calls <- function(code) {
  calls <- list()
  walk <- function(x) {
    calls[[length(calls) + 1L]] <<- x
    for (i in seq_along(x)) if (is.call(x[[i]])) walk(x[[i]])
  }
  for (e in parse(text = code, keep.source = FALSE)) if (is.call(e)) walk(e)
  calls
}

# The function a call invokes: "f" for both f() and pkg::f().
call_fun <- function(cl) {
  f <- cl[[1]]
  if (is.symbol(f)) return(as.character(f))
  if (is.call(f) && is.symbol(f[[1]]) &&
      as.character(f[[1]]) %in% c("::", ":::")) return(as.character(f[[3]]))
  NA_character_
}

# Packages: attached with library()/require() or called with pkg::.
code_packages <- function(code) {
  pkgs <- character()
  for (cl in code_calls(code)) {
    fn <- call_fun(cl)
    if (fn %in% c("library", "require") && length(cl) > 1L) {
      pkg <- if (is.null(cl$package)) cl[[2]] else cl$package
      pkgs <- c(pkgs, as.character(pkg))
    } else if (fn %in% c("::", ":::")) {
      pkgs <- c(pkgs, as.character(cl[[2]]))
    }
  }
  setdiff(unique(pkgs), base_r_pkgs)
}

# Colour literals: a hex code or an R colour name, typed as a string.
is_colour <- function(s) {
  grepl("^#([[:xdigit:]]{3}|[[:xdigit:]]{6}|[[:xdigit:]]{8})$", s) ||
    s %in% grDevices::colors()
}
colour_args <- function(cl) {
  n <- 0L
  for (i in seq_along(cl)[-1L]) {
    if (is.character(cl[[i]]) && length(cl[[i]]) == 1L && is_colour(cl[[i]])) {
      n <- n + 1L
    }
  }
  n
}

# All tallies for one piece of code.
code_tally <- function(code) {
  calls   <- code_calls(code)
  fns     <- vapply(calls, call_fun, character(1))
  colours <- vapply(calls, colour_args, integer(1))
  keytype <- vapply(calls, function(cl) "keytype" %in% names(cl), logical(1))
  id_map  <- fns %in% id_mapping_fns | (fns %in% "select" & keytype)
  list(
    lines          = count_lines(code),
    packages       = code_packages(code),
    library_calls  = sum(fns %in% c("library", "require")),
    id_mapping     = fns[id_map],
    colour_vectors = sum(fns %in% "c" & colours > 0L),
    colour_values  = sum(colours)
  )
}

# One row per step and workflow. `get_code(label)` returns a chunk's source.
# A step's `packages` are those not already counted at an earlier step, so
# the steps of a workflow sum to its distinct packages.
code_economy <- function(get_code, steps = economy_steps) {
  rows <- list()
  for (wf in names(steps)) {
    seen <- character()
    for (st in names(steps[[wf]])) {
      code <- unlist(lapply(steps[[wf]][[st]], function(label) {
        chunk <- get_code(label)
        if (is.null(chunk) || count_lines(chunk) == 0L) {
          stop("Chunk '", label, "' is missing or has no countable code.")
        }
        as.character(chunk)
      }))
      tally <- code_tally(code)
      new_pkgs <- setdiff(tally$packages, seen)
      seen <- c(seen, new_pkgs)
      rows[[length(rows) + 1L]] <- data.frame(
        step             = st,
        workflow         = wf,
        lines            = tally$lines,
        packages         = length(new_pkgs),
        package_names    = paste(new_pkgs, collapse = ", "),
        library_calls    = tally$library_calls,
        id_mapping_calls = length(tally$id_mapping),
        id_mapping_fns   = paste(unique(tally$id_mapping), collapse = ", "),
        colour_vectors   = tally$colour_vectors,
        colour_values    = tally$colour_values
      )
    }
  }
  do.call(rbind, rows)
}

# One "Total" row per workflow.
economy_totals <- function(economy) {
  per_wf <- split(economy, factor(economy$workflow, unique(economy$workflow)))
  do.call(rbind, lapply(per_wf, function(d) {
    join <- function(x) paste(unique(x[nzchar(x)]), collapse = ", ")
    data.frame(
      step             = "Total",
      workflow         = d$workflow[1],
      lines            = sum(d$lines),
      packages         = sum(d$packages),
      package_names    = join(d$package_names),
      library_calls    = sum(d$library_calls),
      id_mapping_calls = sum(d$id_mapping_calls),
      id_mapping_fns   = join(d$id_mapping_fns),
      colour_vectors   = sum(d$colour_vectors),
      colour_values    = sum(d$colour_values),
      row.names        = NULL
    )
  }))
}
# knitr has parsed every chunk before running any, so the whole document's
# code is available here.
economy       <- code_economy(function(label) knitr::knit_code$get(label))
economy_total <- economy_totals(economy)

# Shorthands for the counts quoted in the text.
eco <- function(workflow, step, what = "lines") {
  economy[economy$workflow == workflow & economy$step == step, what]
}
tot <- function(workflow, what = "lines") {
  economy_total[economy_total$workflow == workflow, what]
}
chunk_lines <- function(label) count_lines(knitr::knit_code$get(label))
named_args <- function(label, fn) {
  calls <- code_calls(knitr::knit_code$get(label))
  cl <- calls[[match(fn, vapply(calls, call_fun, character(1)))]]
  sum(nzchar(names(cl)))
}
n_of <- function(n, what) paste(n, if (n == 1) what else paste0(what, "s"))
pct_less <- function(standard, vista) {
  paste0(round(100 * (standard - vista) / standard), "%")
}
pkg_list <- function(workflow) {
  knitr::combine_words(strsplit(tot(workflow, "package_names"), ", ")[[1]])
}
fn_list <- function(fns) {
  if (!nzchar(fns)) return("none")
  knitr::combine_words(paste0("`", strsplit(fns, ", ")[[1]], "()`"))
}
steps_with <- function(workflow, what) {
  economy$step[economy$workflow == workflow & economy[[what]] > 0]
}

# Wording for the DESeq2 cross-check in the Summary section.
describe_de_check <- function(genes_differing, vista_de, std_de, same_genes) {
  if (!same_genes) {
    return("the two workflows do not test the same genes, so their results differ")
  }
  same <- names(genes_differing)[genes_differing == 0L]
  diff <- names(genes_differing)[genes_differing > 0L]
  if (!length(diff)) {
    return(paste0("the two workflows test the same ", nrow(vista_de),
                  " genes and give identical results in every column compared"))
  }
  out <- paste0(
    "the two workflows test the same genes and agree exactly in ",
    knitr::combine_words(paste0("`", same, "`")), " for all ",
    nrow(vista_de), " genes, and differ in ",
    knitr::combine_words(paste0("`", diff, "` (", genes_differing[diff],
                                " genes)"))
  )
  idx <- which(xor(is.na(vista_de$pvalue), is.na(std_de$pvalue)))
  if (identical(diff, "pvalue") && length(idx) == genes_differing[["pvalue"]] &&
      all(is.na(std_de$pvalue[idx])) && sum(is.na(std_de$pvalue)) == length(idx)) {
    out <- paste0(
      out, ". These are exactly the genes for which DESeq2 reports no ",
      "p-value (`NA`); for them the installed VISTA (",
      utils::packageVersion("VISTA"), ") stores a p-value of ",
      knitr::combine_words(unique(vista_de$pvalue[idx])),
      " while leaving `padj` as `NA`"
    )
  }
  out
}
Session Information
sessionInfo()
#> R version 4.6.1 (2026-06-24)
#> Platform: x86_64-pc-linux-gnu
#> Running under: Ubuntu 24.04.5 LTS
#>
#> Matrix products: default
#> BLAS:   /usr/lib/x86_64-linux-gnu/openblas-pthread/libblas.so.3
#> LAPACK: /usr/lib/x86_64-linux-gnu/openblas-pthread/libopenblasp-r0.3.26.so;  LAPACK version 3.12.0
#>
#> locale:
#>  [1] LC_CTYPE=C.UTF-8       LC_NUMERIC=C           LC_TIME=C.UTF-8
#>  [4] LC_COLLATE=C.UTF-8     LC_MONETARY=C.UTF-8    LC_MESSAGES=C.UTF-8
#>  [7] LC_PAPER=C.UTF-8       LC_NAME=C              LC_ADDRESS=C
#> [10] LC_TELEPHONE=C         LC_MEASUREMENT=C.UTF-8 LC_IDENTIFICATION=C
#>
#> time zone: UTC
#> tzcode source: system (glibc)
#>
#> attached base packages:
#> [1] grid      stats4    stats     graphics  grDevices utils     datasets
#> [8] methods   base
#>
#> other attached packages:
#>  [1] VISTA_1.1.7                 circlize_0.4.18
#>  [3] ComplexHeatmap_2.28.0       msigdbr_26.1.1
#>  [5] clusterProfiler_4.20.3      tibble_3.3.1
#>  [7] dplyr_1.2.1                 ggrepel_0.9.8
#>  [9] ggplot2_4.0.3               DESeq2_1.52.0
#> [11] org.Hs.eg.db_3.23.1         AnnotationDbi_1.74.0
#> [13] airway_1.32.0               SummarizedExperiment_1.42.0
#> [15] Biobase_2.72.0              GenomicRanges_1.64.0
#> [17] Seqinfo_1.2.0               IRanges_2.46.0
#> [19] S4Vectors_0.50.3            BiocGenerics_0.58.1
#> [21] generics_0.1.4              MatrixGenerics_1.24.0
#> [23] matrixStats_1.5.0           BiocStyle_2.40.0
#>
#> loaded via a namespace (and not attached):
#>   [1] splines_4.6.1           ggplotify_0.1.4         polyclip_1.10-7
#>   [4] enrichit_0.2.6          lifecycle_1.0.5         httr2_1.3.0
#>   [7] rstatix_1.1.0           edgeR_4.10.7            doParallel_1.0.17
#>  [10] processx_3.9.0          lattice_0.22-9          MASS_7.3-65
#>  [13] backports_1.5.1         magrittr_2.0.5          limma_3.68.5
#>  [16] sass_0.4.10             rmarkdown_2.32          jquerylib_0.1.4
#>  [19] yaml_2.3.12             otel_0.2.0              ggtangle_0.1.4
#>  [22] EnhancedVolcano_1.30.0  DBI_1.3.0               RColorBrewer_1.1-3
#>  [25] abind_1.4-8             purrr_1.2.2             yulab.utils_0.2.5
#>  [28] tweenr_2.0.3            rappdirs_0.3.4          aisdk_1.4.12
#>  [31] gdtools_0.5.2           enrichplot_1.32.1       tidytree_0.4.8
#>  [34] pkgdown_2.2.1           codetools_0.2-20        DelayedArray_0.38.2
#>  [37] DOSE_4.6.0              ggforce_0.5.0           tidyselect_1.2.1
#>  [40] shape_1.4.6.1           aplot_0.3.2             farver_2.1.2
#>  [43] jsonlite_2.0.0          GetoptLong_1.1.1        Formula_1.2-6
#>  [46] iterators_1.0.14        systemfonts_1.3.2       foreach_1.5.2
#>  [49] tools_4.6.1             ggnewscale_0.5.2        treeio_1.36.1
#>  [52] ragg_1.5.2              Rcpp_1.1.2              glue_1.8.1
#>  [55] SparseArray_1.12.3      xfun_0.62               qvalue_2.44.0
#>  [58] withr_3.0.3             BiocManager_1.30.27     fastmap_1.2.0
#>  [61] GGally_2.4.0            callr_3.8.0             digest_0.6.39
#>  [64] R6_2.6.1                gridGraphics_0.5-1      textshaping_1.0.5
#>  [67] colorspace_2.1-4        GO.db_3.23.1            RSQLite_3.53.3
#>  [70] tidyr_1.3.2             fontLiberation_0.1.0    httr_1.4.9
#>  [73] htmlwidgets_1.6.4       S4Arrays_1.12.1         scatterpie_0.2.6
#>  [76] ggstats_0.14.0          pkgconfig_2.0.3         gtable_0.3.6
#>  [79] blob_1.3.0              S7_0.2.2                XVector_0.52.0
#>  [82] htmltools_0.5.9         fontBitstreamVera_0.1.1 carData_3.0-6
#>  [85] bookdown_0.48           clue_0.3-68             scales_1.4.0
#>  [88] png_0.1-9               ggfun_0.2.2             knitr_1.52
#>  [91] reshape2_1.4.5          rjson_0.2.23            nlme_3.1-169
#>  [94] cachem_1.1.0            GlobalOptions_0.1.4     stringr_1.6.0
#>  [97] parallel_4.6.1          desc_1.4.3              pillar_1.11.1
#> [100] vctrs_0.7.3             ggpubr_1.0.0            car_3.1-5
#> [103] tidydr_0.0.7            cluster_2.1.8.2         evaluate_1.0.5
#> [106] cli_3.6.6               locfit_1.5-9.12         compiler_4.6.1
#> [109] rlang_1.3.0             crayon_1.5.3            ggsignif_0.6.4
#> [112] labeling_0.4.3          ps_1.9.3                plyr_1.8.9
#> [115] forcats_1.0.1           fs_2.1.0                ggiraph_0.9.6
#> [118] stringi_1.8.9           BiocParallel_1.46.0     assertthat_0.2.1
#> [121] Biostrings_2.80.2       lazyeval_0.2.3          GOSemSim_2.38.3
#> [124] fontquiver_0.2.1        Matrix_1.7-5            patchwork_1.3.2
#> [127] bit64_4.8.6             KEGGREST_1.52.2         statmod_1.5.2
#> [130] igraph_2.3.4            broom_1.0.13            memoise_2.0.1
#> [133] bslib_0.12.0            ggtree_4.2.0            bit_4.6.0
#> [136] ape_5.8-1               gson_0.2.2
References
- Himes BE et al. (2014). “RNA-Seq transcriptome profiling identifies CRISPLD2 as a glucocorticoid responsive gene that modulates cytokine function in airway smooth muscle cells.” PLoS One 9(6): e99625.
- Love MI, Huber W, Anders S (2014). “Moderated estimation of fold change and dispersion for RNA-seq data with DESeq2.” Genome Biology 15:550.
- Gu Z et al. (2016). “Complex heatmaps reveal patterns and correlations in multidimensional genomic data.” Bioinformatics 32(18):2847–2849.
- Wu T et al. (2021). “clusterProfiler 4.0: A universal enrichment tool for interpreting omics data.” The Innovation 2(3):100141.