Summarizes expression for selected genes/groups via ComplexHeatmap
with optional transformations and annotations. With only a VISTA
object, the function will plot the top variable genes across all samples.
Usage
get_expression_heatmap(
  x,
  genes = NULL,
  top_n = 50,
  sample_group = NULL,
  group_column = NULL,
  value_transform = c("zscore", "log2", "raw"),
  summarise_replicates = TRUE,
  summarise_method = c("mean", "median"),
  convert_rowmeans = FALSE,
  display_id = NULL,
  display_from = NULL,
  display_orgdb = NULL,
  repair_genes = FALSE,
  show_row_names = NULL,
  label_size = 10,
  label_specific_rows = NULL,
  label_specific_rows_gp = grid::gpar(fontsize = 5),
  show_column_names = TRUE,
  cluster_rows = TRUE,
  show_row_dend = TRUE,
  cluster_columns = TRUE,
  kmeans_k = NULL,
  annotate_columns = FALSE,
  cluster_by = NULL,
  column_anno_palette = "Dark 3",
  column_anno_colors = NULL,
  color_default = TRUE,
  col = NULL,
  heatmap_name = NULL,
  show_heatmap_legend = TRUE,
  return_type = c("heatmap", "clusters", "both"),
  ...
)
Arguments
- x
A
VISTAobject.- genes
Optional character vector of gene identifiers to display. When omitted, VISTA selects the top variable genes across the included samples.
- top_n
Integer number of genes to select automatically when
genes = NULL. Defaults to50.- sample_group
Character vector of group labels specifying which samples to include (based on the selected grouping column).
- group_column
Optional column name in
sample_infoused to interpretsample_group.- value_transform
One of
"zscore","log2", or"raw"controlling how expression values are transformed.- summarise_replicates
Logical; average replicates per group before plotting when
TRUE.- summarise_method
"mean"or"median"summarization used whensummarise_replicates = TRUE.- convert_rowmeans
Logical; subtract row means prior to plotting.
- display_id
Optional ID/column name to use for row labels. If supplied
- display_from
Optional source ID type for mapping (used when
display_id- display_orgdb
Optional
OrgDbobject used for ID mapping when- repair_genes
Logical; if
TRUE, splitgene_idstrings such asID:SYMBOLto display the symbol.- show_row_names
Logical; display row names (genes) beside the heatmap. When
NULL, VISTA turns labels on automatically for auto-selected genes.- label_size
Numeric font size for row names.
- label_specific_rows
Optional character vector of row names to highlight via
anno_mark().- label_specific_rows_gp
grid::gpar()object controlling the highlighted row labels.- show_column_names
Logical; draw column names when
TRUE.- cluster_rows
Logical; cluster rows when drawing the heatmap.
- show_row_dend
Logical; display the row dendrogram.
- cluster_columns
Logical; cluster columns.
- kmeans_k
Optional integer specifying the number of k-means clusters to compute for rows.
- annotate_columns
Logical or character vector.
TRUEadds thegroup_columnannotation and also includescluster_bywhen supplied; a character vector adds multiple annotations fromsample_info.- cluster_by
Optional annotation column used to split/cluster columns. Defaults to the first annotation column when
annotate_columnsis enabled.- column_anno_palette
Qualitative palette name used for the column annotation.
- column_anno_colors
Optional named list of annotation color vectors. Each element should be a named character vector keyed by the levels of one annotation column.
- color_default
Logical; use the default blue-white-red palette when
TRUE. Set toFALSEto supplycol.- col
Optional
circlize::colorRamp2function used whencolor_default = FALSE.- heatmap_name
Optional legend title.
- show_heatmap_legend
Logical; display the heatmap legend.
- return_type
"heatmap","clusters", or"both"selecting the returned object.- ...
Additional arguments passed to
ComplexHeatmap::Heatmap().
Value
An object returned by this function.
A ComplexHeatmap object, a cluster data frame, or a list containing
both depending on return_type.
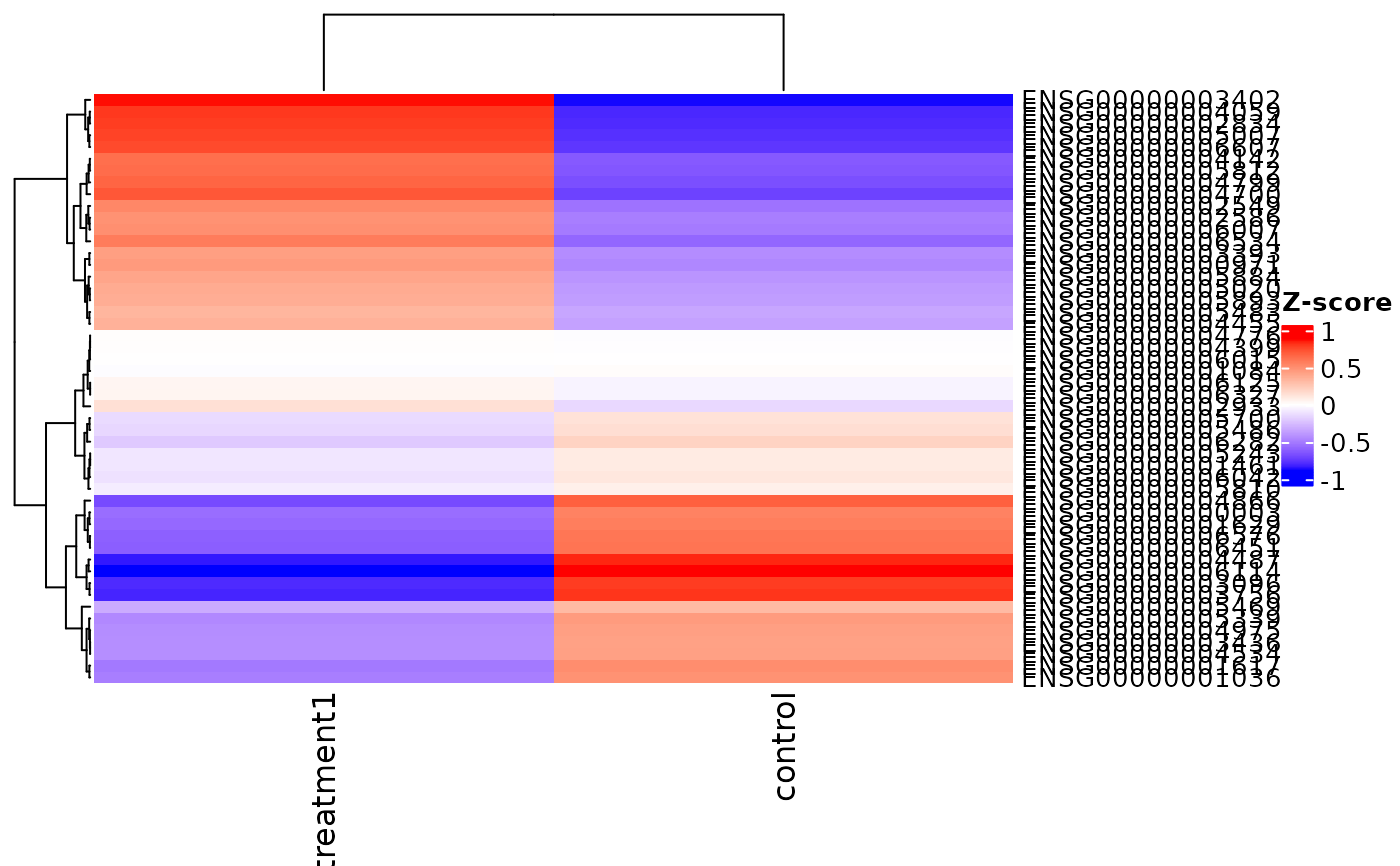
Examples
v <- example_vista()
genes <- head(rownames(v), 20)
if (requireNamespace('ComplexHeatmap', quietly = TRUE) &&
requireNamespace('circlize', quietly = TRUE)) {
hm <- get_expression_heatmap(
v,
genes = genes,
sample_group = unique(as.character(sample_info(v)$cond_long)),
return_type = 'heatmap'
)
ComplexHeatmap::draw(hm)
}
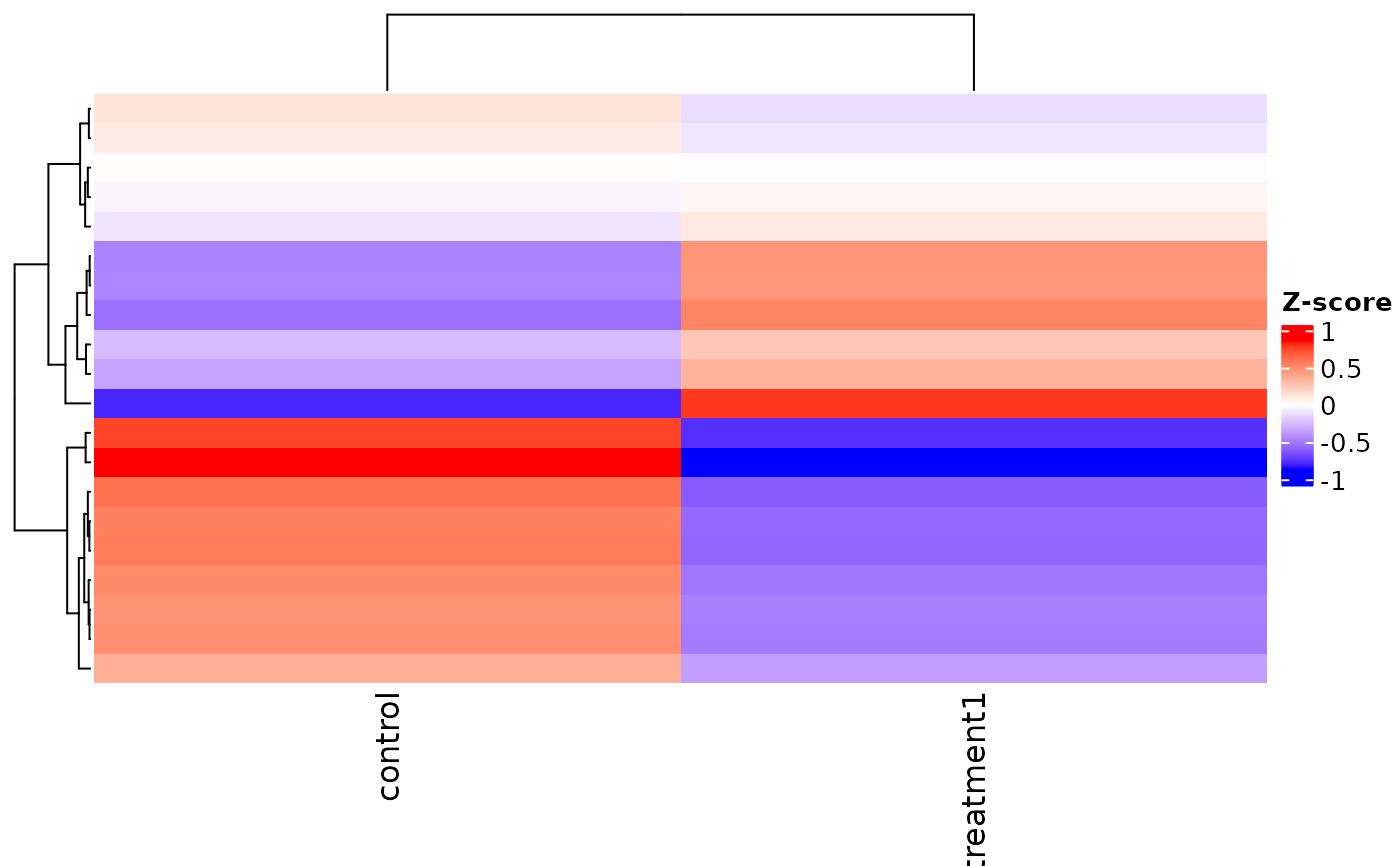 v <- example_vista()
if (requireNamespace("ComplexHeatmap", quietly = TRUE) &&
requireNamespace("circlize", quietly = TRUE)) {
hm <- get_expression_heatmap(v, return_type = "heatmap")
ComplexHeatmap::draw(hm)
}
v <- example_vista()
if (requireNamespace("ComplexHeatmap", quietly = TRUE) &&
requireNamespace("circlize", quietly = TRUE)) {
hm <- get_expression_heatmap(v, return_type = "heatmap")
ComplexHeatmap::draw(hm)
}