Uses normalized counts to compute principal components and plot samples, optionally restricting to selected groups or genes.
Usage
get_pca_plot(
  x,
  sample_group = NULL,
  group_column = NULL,
  genes = NULL,
  top_n_genes = NULL,
  label = FALSE,
  label_size = 3,
  point_size = 10,
  shape_by = NULL,
  shape_values = NULL,
  sample.seed = 123,
  show_clusters = FALSE,
  color_by = NULL,
  use_vista_colors = NULL,
  palette = NULL,
  colors = NULL,
  use_group_colors = TRUE
)
Arguments
- x
A
VISTAobject containing normalized counts.- sample_group
Optional character vector of group labels (taken from the column specified by
group_column, defaulting to the stored grouping column) used to subset samples prior to PCA. UseNULLto include all samples.- group_column
Optional column name in
sample_infoto use for grouping. Defaults to the stored grouping column.- genes
Optional character vector of gene identifiers to restrict the PCA input matrix. When
NULL, all genes are used.- top_n_genes
Optional integer selecting the top most variable genes to include. Ignored when
genesis supplied.- label
Logical; if
TRUE, sample names are drawn next to the points.- label_size
Numeric size of sample labels when
label = TRUE.- point_size
Numeric size of the plotted points.
- shape_by
Optional column name in
sample_infoused to map point shape. WhenNULL, shapes are not mapped.- shape_values
Optional vector of shapes passed to
scale_shape_manual()whenshape_byis set. Use a named vector to map shapes to specific levels.- sample.seed
Deprecated/unused; retained for backward compatibility.
- show_clusters
Logical; add normal ellipses per group when
TRUE.- color_by
Optional column name in
sample_infoused to map point colour. Defaults to the active grouping column.- use_vista_colors
Deprecated alias for
use_group_colors. When supplied, it overridesuse_group_colors.- palette
Optional qualitative palette name used when generating colours for non-group metadata levels.
- colors
Optional named character vector of manual colours overriding both
paletteand stored VISTA colours.- use_group_colors
Logical; when
TRUE, prefer the stored VISTA group colours when colouring by the grouping column.
Examples
# Create VISTA object
data("count_data", package = "VISTA")
data("sample_metadata", package = "VISTA")
vista <- create_vista(
counts = count_data[seq_len(200), ],
sample_info = sample_metadata[seq_len(6), ],
column_geneid = "gene_id",
group_column = "cond_long",
group_numerator = "treatment1",
group_denominator = "control"
)
#> estimating size factors
#> estimating dispersions
#> gene-wise dispersion estimates
#> mean-dispersion relationship
#> final dispersion estimates
#> fitting model and testing
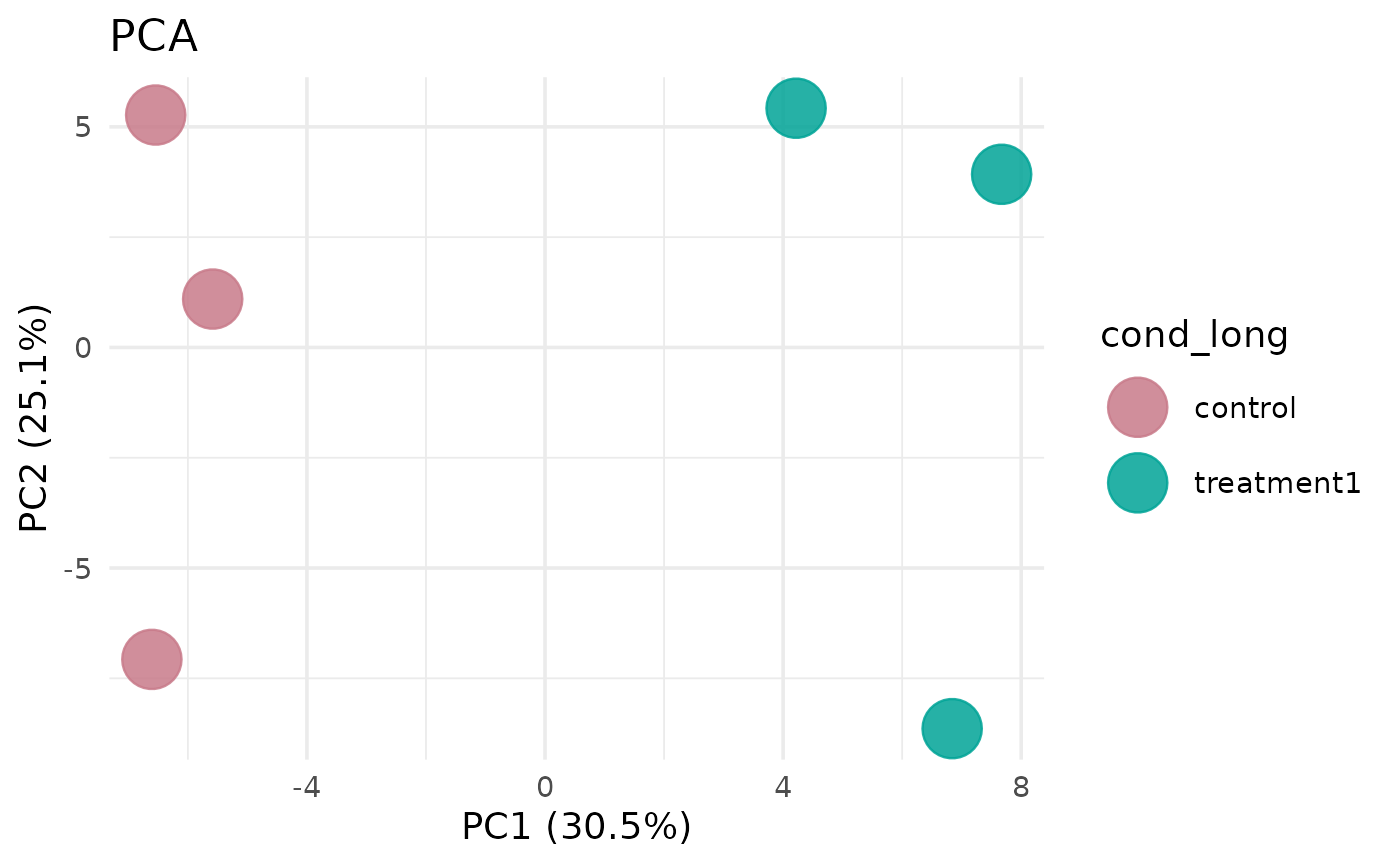
# Basic PCA plot
get_pca_plot(vista)
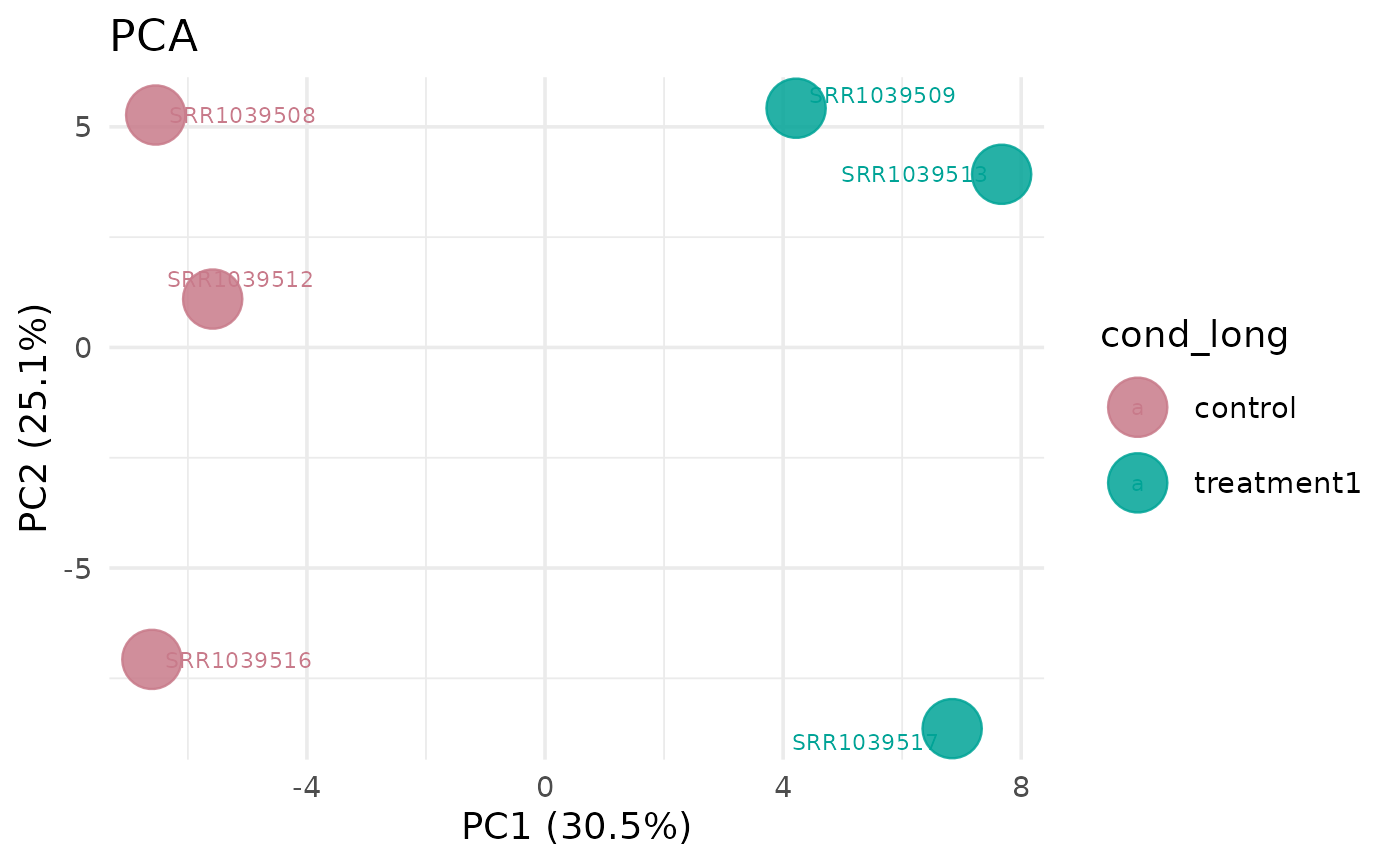
 # With sample labels
get_pca_plot(vista, label = TRUE)
# With sample labels
get_pca_plot(vista, label = TRUE)
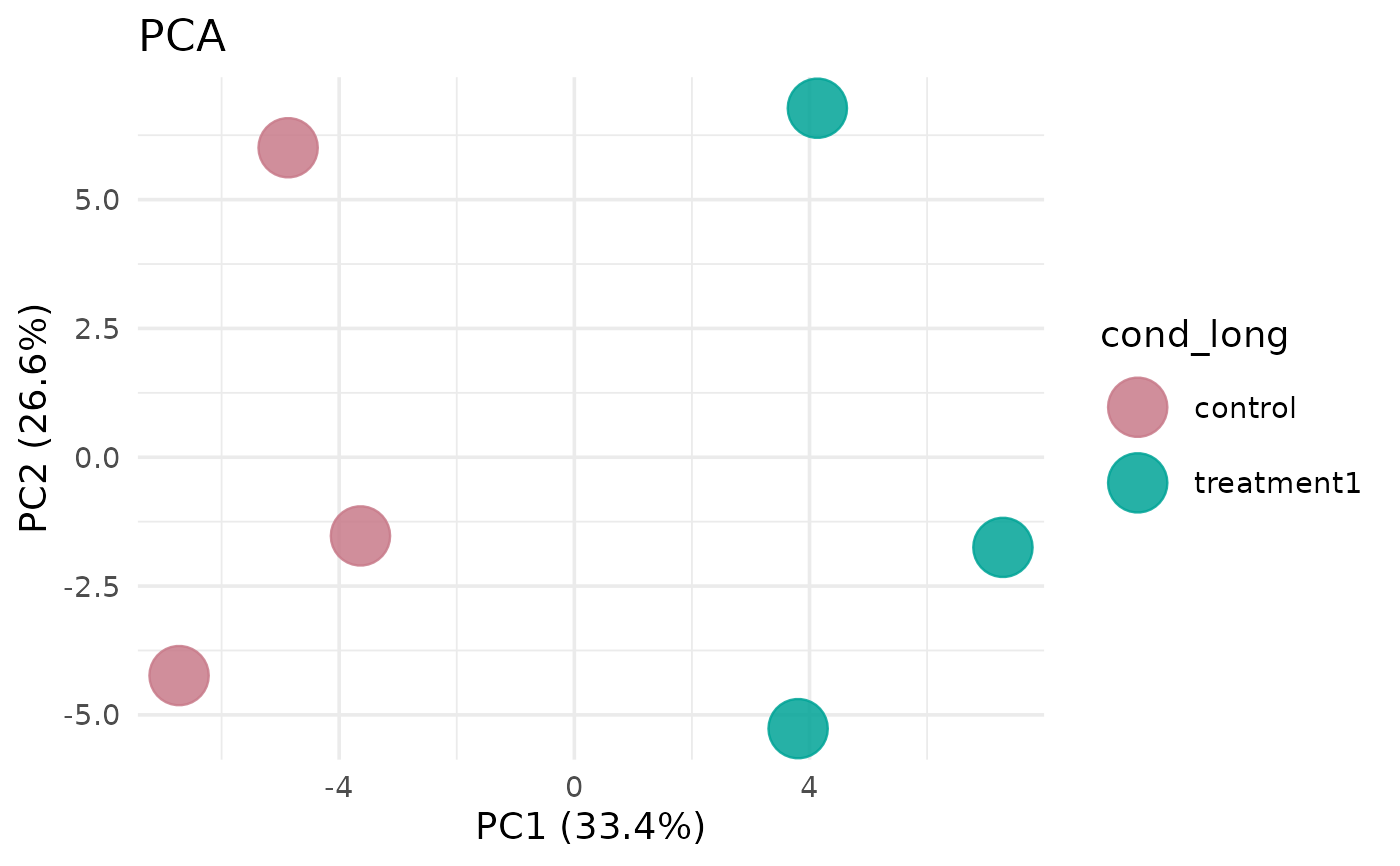
 # Using top variable genes
get_pca_plot(vista, top_n_genes = 100)
# Using top variable genes
get_pca_plot(vista, top_n_genes = 100)
 # With confidence ellipses
get_pca_plot(vista, show_clusters = TRUE)
#> Too few points to calculate an ellipse
#> Too few points to calculate an ellipse
#> Warning: Removed 2 rows containing missing values or values outside the scale range
#> (`geom_path()`).
# With confidence ellipses
get_pca_plot(vista, show_clusters = TRUE)
#> Too few points to calculate an ellipse
#> Too few points to calculate an ellipse
#> Warning: Removed 2 rows containing missing values or values outside the scale range
#> (`geom_path()`).
