Generate a volcano plot for a comparison in a VISTA object
Source:R/viz_related.R
get_volcano_plot.RdWraps EnhancedVolcano to visualize log2FC vs p-values for a selected comparison.
Usage
get_volcano_plot(
  x,
  sample_comparison,
  log2fc_cutoff = 1,
  pval_cutoff = 0.05,
  label_genes = NULL,
  label_size = 3,
  point_size = 1,
  colors = c(Up = "#a40000", Down = "#007e2f", Other = "grey"),
  repair_genes = TRUE,
  display_id = NULL,
  display_from = NULL,
  display_orgdb = NULL,
  ...
)
Arguments
- x
A
VISTAobject containing differential expression results.- sample_comparison
Character scalar naming the comparison to display.
- log2fc_cutoff
Numeric absolute log2 fold-change threshold used to color significant points.
- pval_cutoff
Numeric p-value threshold used to color significant points.
- label_genes
Optional character vector of gene identifiers to force-label.
- label_size
Numeric label text size.
- point_size
Numeric point size.
- colors
Named colour vector with entries for
"Up","Down", and"Other".- repair_genes
Logical; when
TRUE, splitgene_idvalues likeID:SYMBOLto display the symbol.- display_id
Optional ID/column name to use for plot labels. If supplied and present in
rowData(x), those values are used; otherwise falls back to ID mapping.- display_from
Optional source ID type for mapping (used when
display_idis not found inrowData).- display_orgdb
Optional
OrgDbobject used for ID mapping whendisplay_idis set but not found inrowData.- ...
Additional parameters forwarded to
EnhancedVolcano::EnhancedVolcano().
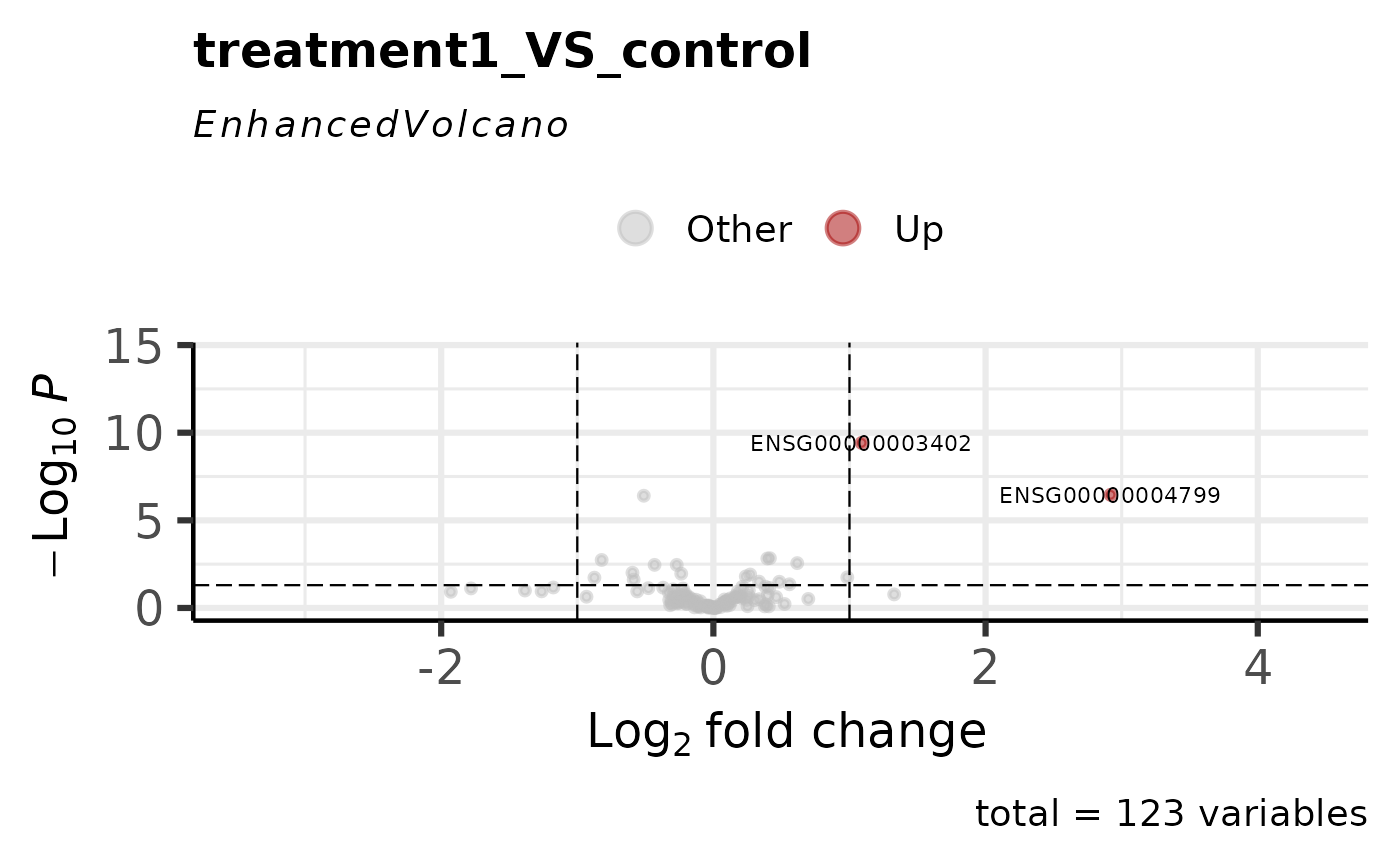
Examples
vista <- example_vista()
comps <- names(comparisons(vista))
get_volcano_plot(vista, sample_comparison = comps[1])
#> Warning: Using `size` aesthetic for lines was deprecated in ggplot2 3.4.0.
#> ℹ Please use `linewidth` instead.
#> ℹ The deprecated feature was likely used in the EnhancedVolcano package.
#> Please report the issue to the authors.
#> Warning: The `size` argument of `element_line()` is deprecated as of ggplot2 3.4.0.
#> ℹ Please use the `linewidth` argument instead.
#> ℹ The deprecated feature was likely used in the EnhancedVolcano package.
#> Please report the issue to the authors.
 # \donttest{
# Create VISTA object
data("count_data", package = "VISTA")
data("sample_metadata", package = "VISTA")
vista <- create_vista(
counts = count_data,
sample_info = sample_metadata,
column_geneid = "gene_id",
group_column = "cond_long",
group_numerator = "treatment1",
group_denominator = "control"
)
#> estimating size factors
#> estimating dispersions
#> gene-wise dispersion estimates
#> mean-dispersion relationship
#> final dispersion estimates
#> fitting model and testing
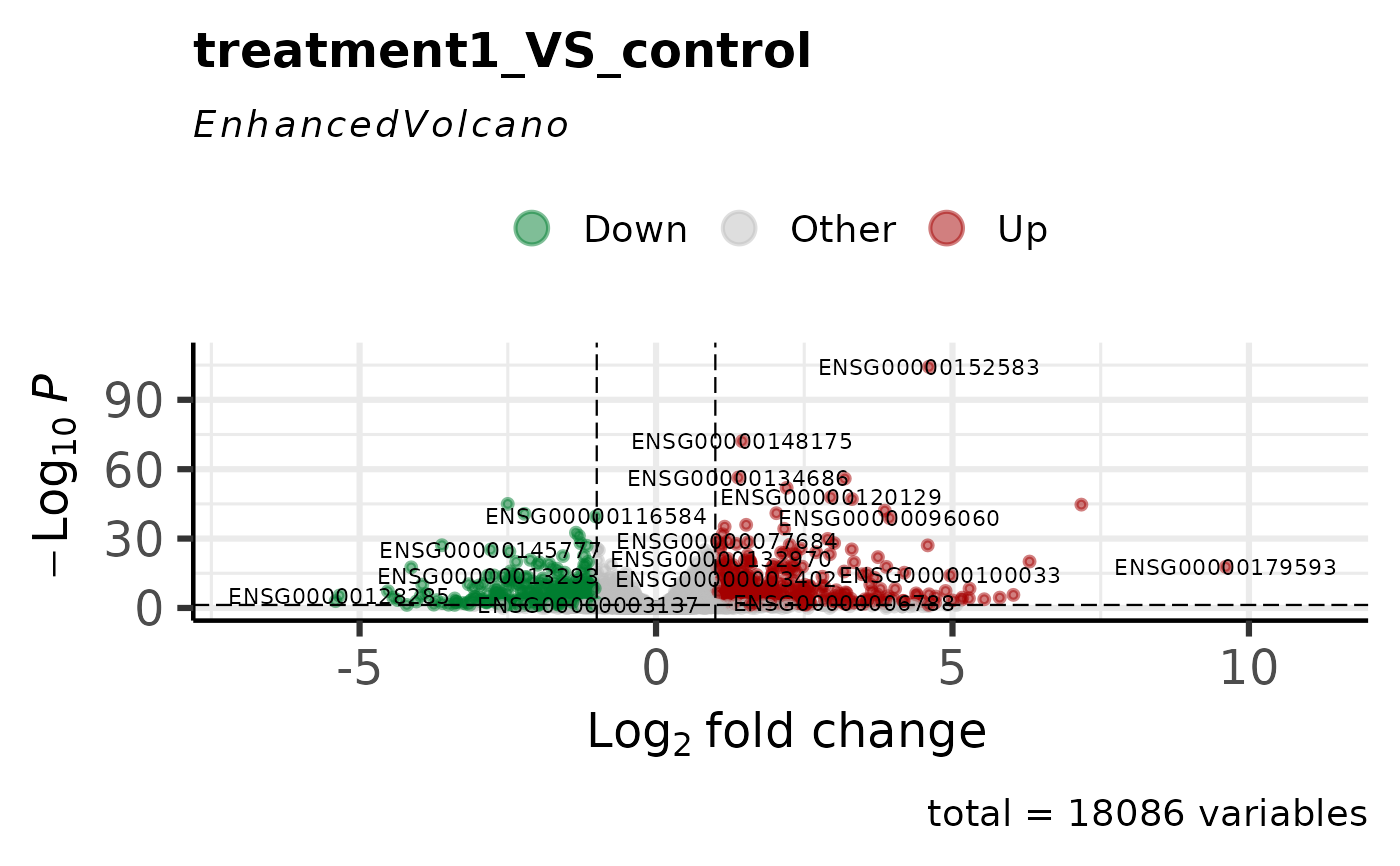
# Basic volcano plot
comps <- names(comparisons(vista))
get_volcano_plot(vista, sample_comparison = comps[1])
# \donttest{
# Create VISTA object
data("count_data", package = "VISTA")
data("sample_metadata", package = "VISTA")
vista <- create_vista(
counts = count_data,
sample_info = sample_metadata,
column_geneid = "gene_id",
group_column = "cond_long",
group_numerator = "treatment1",
group_denominator = "control"
)
#> estimating size factors
#> estimating dispersions
#> gene-wise dispersion estimates
#> mean-dispersion relationship
#> final dispersion estimates
#> fitting model and testing
# Basic volcano plot
comps <- names(comparisons(vista))
get_volcano_plot(vista, sample_comparison = comps[1])
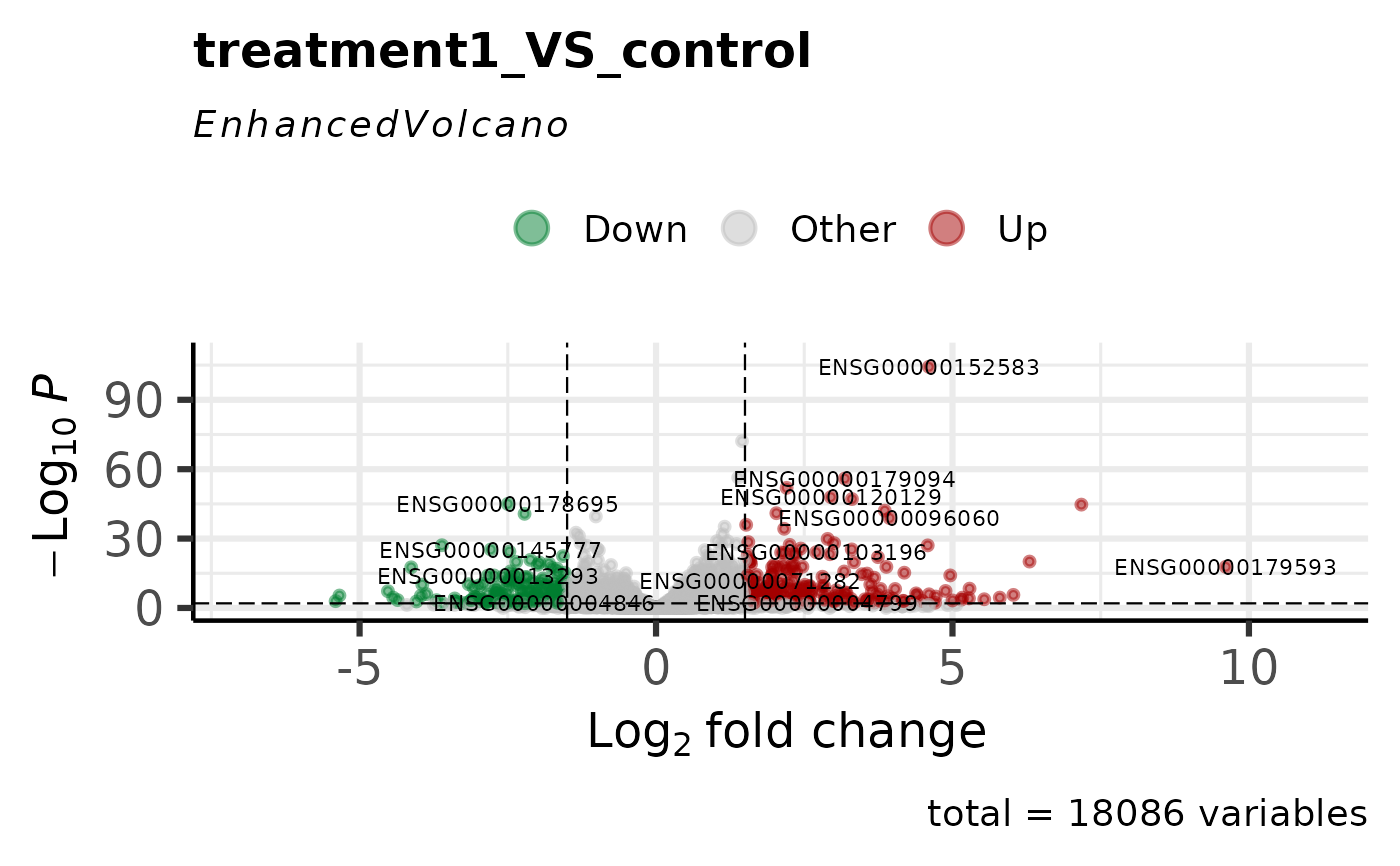
 # With custom thresholds
get_volcano_plot(
vista,
sample_comparison = comps[1],
log2fc_cutoff = 1.5,
pval_cutoff = 0.01
)
# With custom thresholds
get_volcano_plot(
vista,
sample_comparison = comps[1],
log2fc_cutoff = 1.5,
pval_cutoff = 0.01
)
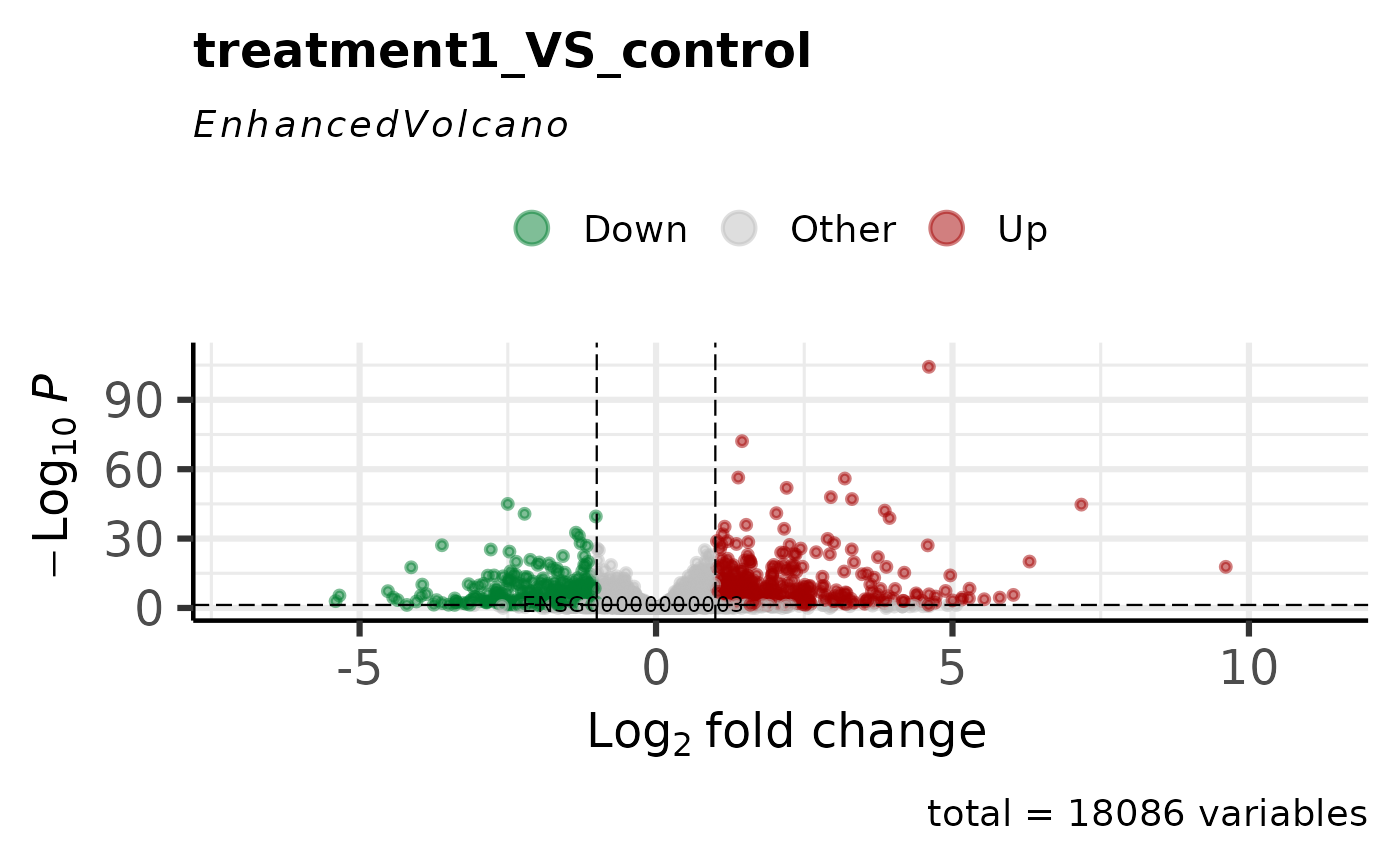
 # Highlight specific genes
genes_of_interest <- rownames(vista)[seq_len(5)]
get_volcano_plot(
vista,
sample_comparison = comps[1],
label_genes = genes_of_interest
)
# Highlight specific genes
genes_of_interest <- rownames(vista)[seq_len(5)]
get_volcano_plot(
vista,
sample_comparison = comps[1],
label_genes = genes_of_interest
)
 # }
# }