Draw a sample correlation heatmap
Source:R/bioccheck_roxygen_fixes.R, R/viz_related.R
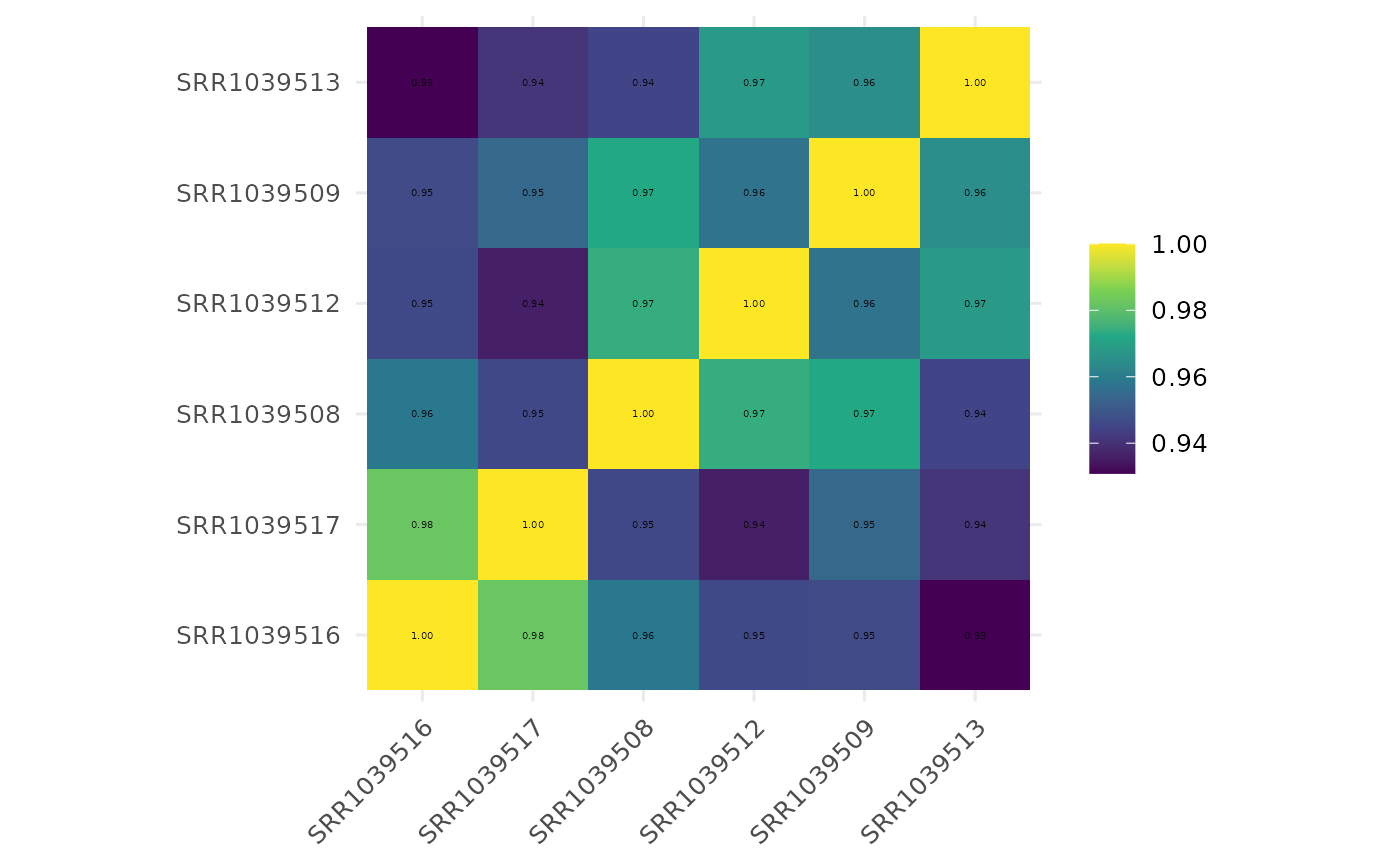
get_corr_heatmap.RdPlots sample-sample correlation matrix derived from normalized counts with optional clustering and annotations.
Usage
get_corr_heatmap(
  x,
  sample_group = NULL,
  group_column = NULL,
  genes = NULL,
  corr_method = "pearson",
  triangle = c("full", "lower", "upper"),
  cluster_by = c("correlation", "group", "input", "none"),
  show_diagonal = TRUE,
  label = TRUE,
  show_corr_values = NULL,
  label_color = "black",
  col_corr_values = NULL,
  label_size = 4,
  limits = NULL,
  base_size = 12,
  viridis_option = "viridis",
  viridis_direction = 1,
  viridis_begin = 0,
  viridis_end = 1
)
Arguments
- x
A
VISTAobject.- sample_group
Optional character vector of groups (referencing
group_column) to include.- group_column
Optional column name in
sample_infodefining the grouping used for filtering.- genes
Optional character vector of gene IDs to limit the matrix.
- corr_method
Correlation method passed to
stats::cor()(e.g.,"pearson").- triangle
Either
"full","lower", or"upper"to control which triangle is drawn.- cluster_by
Ordering strategy for samples:
"correlation"(default),"group","input", or"none".- show_diagonal
Logical; include the correlation diagonal when
TRUE.- label
Logical; overlay correlation coefficients as text.
- show_corr_values
Deprecated alias for
label. When supplied, it overrideslabel.- label_color
Color for the text labels.
- col_corr_values
Deprecated alias for
label_color. When supplied, it overrideslabel_color.- label_size
Numeric text size multiplier.
- limits
Optional numeric vector of length two giving limits for the color scale.
- base_size
Base theme size.
- viridis_option
Character viridis palette name.
- viridis_direction
Integer (1 or -1) controlling palette direction.
- viridis_begin, viridis_end
Palette endpoints between 0 and 1.
Examples
v <- example_vista()
p <- get_corr_heatmap(v)
print(p)