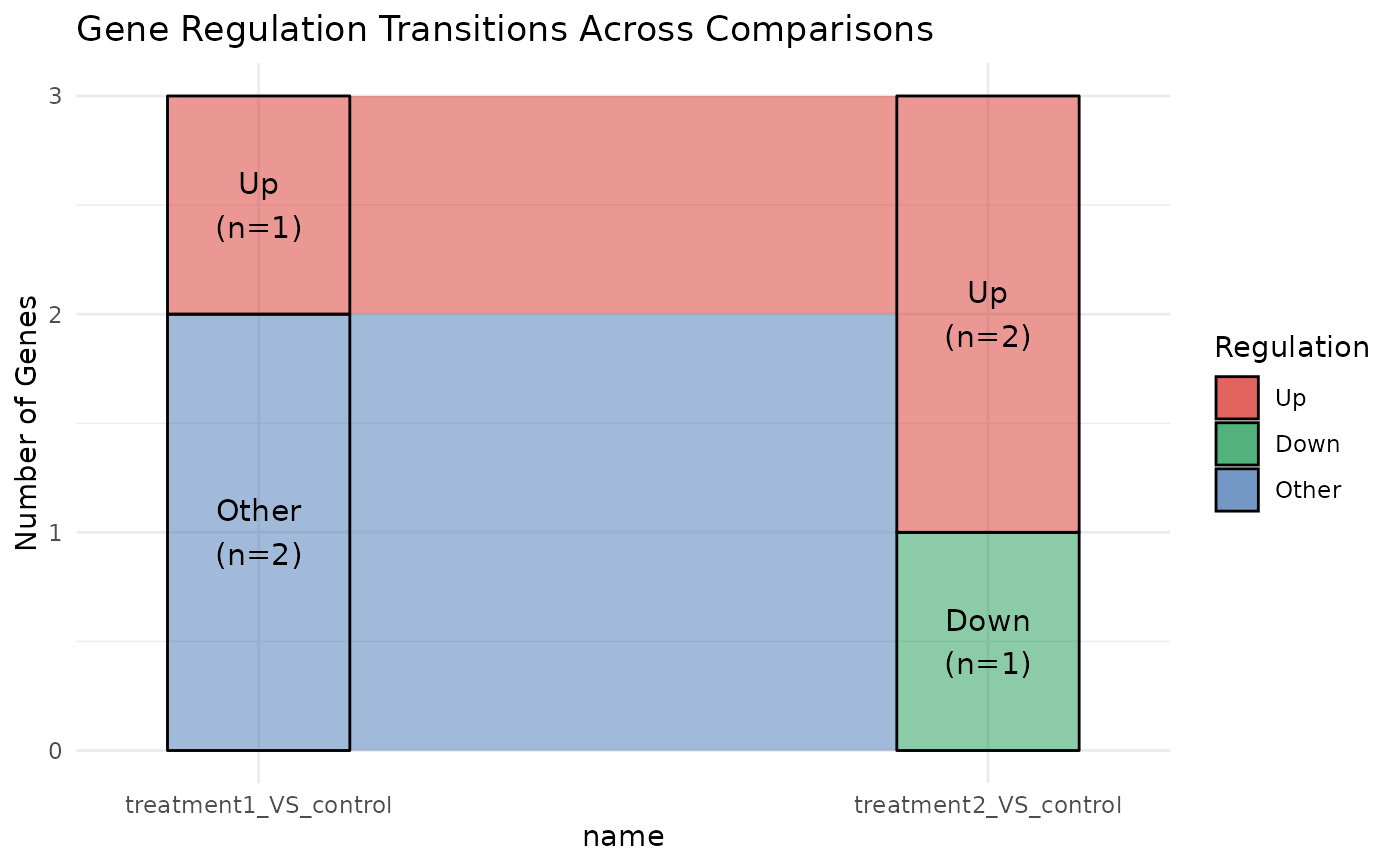
Plot alluvial diagram showing gene regulation transitions across comparisons
Source:R/bioccheck_roxygen_fixes.R, R/viz_related.R
get_deg_alluvial.RdPlot alluvial diagram showing gene regulation transitions across comparisons
Examples
data("count_data", package = "VISTA")
data("sample_metadata", package = "VISTA")
si <- as.data.frame(sample_metadata[seq_len(8), ], stringsAsFactors = FALSE)
trt_idx <- which(si$cond_long == "treatment1")
si$cond_long[trt_idx] <- rep(c("treatment1", "treatment2"), length.out = length(trt_idx))
si$groups <- si$cond_long
v <- create_vista(
  counts = count_data[seq_len(120), c("gene_id", si$sample_names)],
  sample_info = si,
  column_geneid = "gene_id",
  group_column = "cond_long",
  group_numerator = c("treatment1", "treatment2"),
  group_denominator = c("control", "control"),
  min_counts = 5,
  min_replicates = 1
)
#> estimating size factors
#> estimating dispersions
#> gene-wise dispersion estimates
#> mean-dispersion relationship
#> final dispersion estimates
#> fitting model and testing
if (requireNamespace('ggalluvial', quietly = TRUE)) {
  p <- get_deg_alluvial(v, sample_comparisons = names(comparisons(v)))
  print(p)
}
#> Warning: The dot-dot notation (`..stratum..`) was deprecated in ggplot2 3.4.0.
#> ℹ Please use `after_stat(stratum)` instead.
#> ℹ The deprecated feature was likely used in the VISTA package.
#>   Please report the issue at <https://github.com/cparsania/VISTA/issues>.