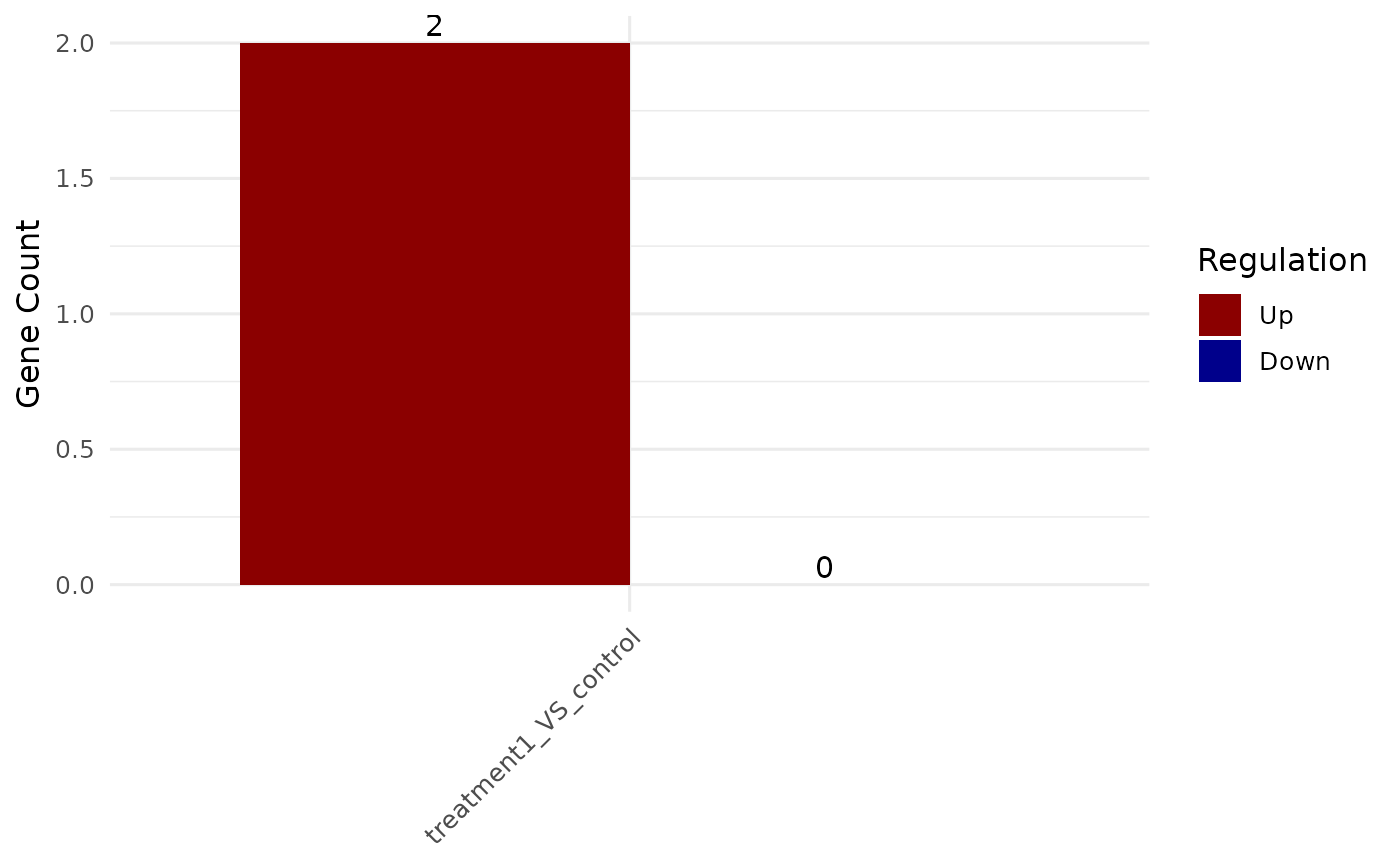
Barplot of DEG counts (Up/Down) across comparisons
Source:R/bioccheck_roxygen_fixes.R, R/viz_related.R
get_deg_count_barplot.RdBarplot of DEG counts (Up/Down) across comparisons
Arguments
- x
A
VISTAobject containing DEG summaries.- sample_comparisons
Optional character vector of comparison names to display.
- label
Logical; overlay numeric counts above bars when
TRUE.- base_size
Numeric base font size for the plot.
- colors
Named vector giving fill colors for
"Up"and"Down"bars.- facet_by
Either
"none","regulation", or"comparison"describing the facet variable. Use"none"for a single panel.- facet_scales
Scale option passed to
facet_wrap()when faceting.
Examples
v <- example_vista()
p <- get_deg_count_barplot(v)
print(p)