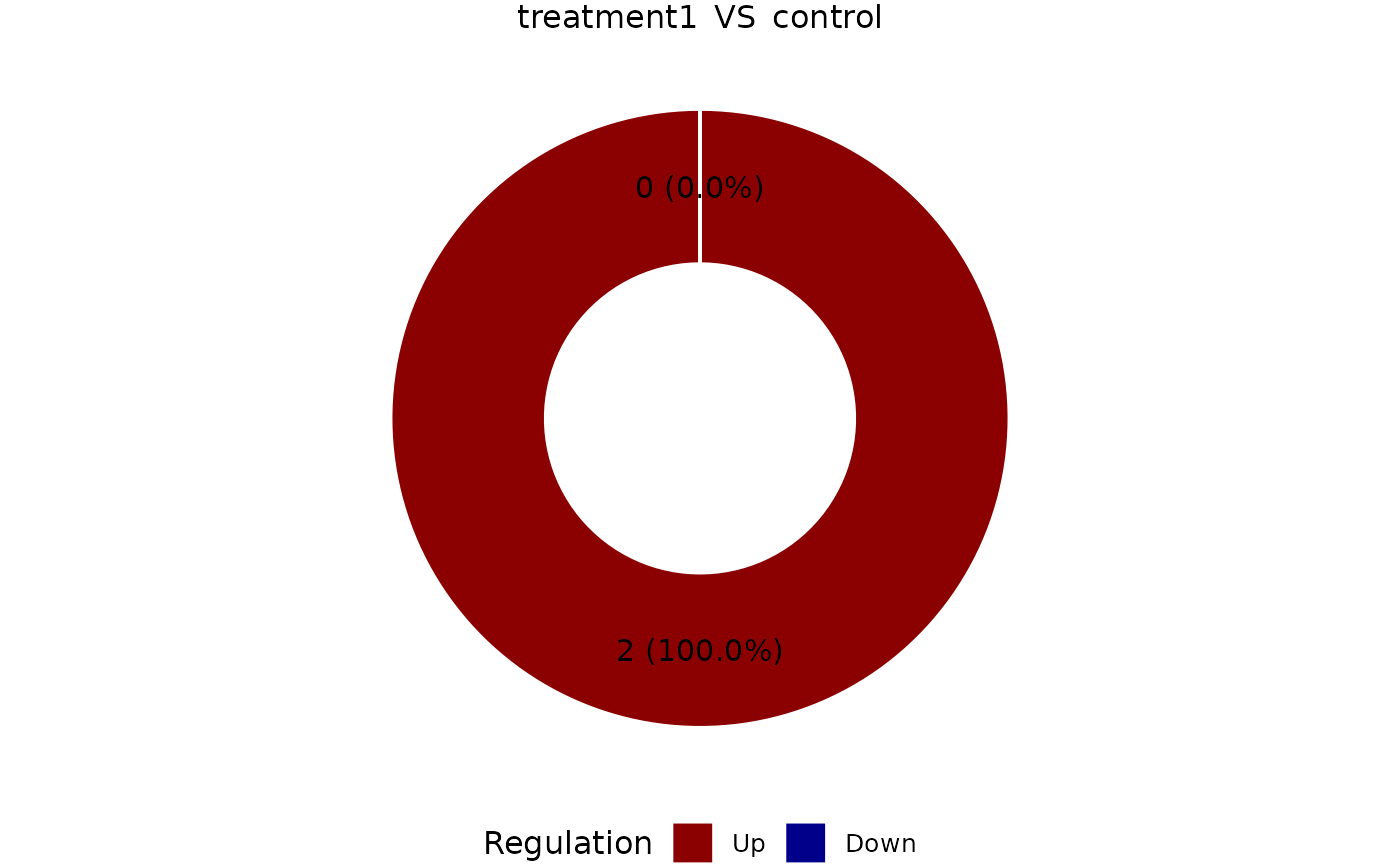
Donut chart of DEG counts (Up/Down) across comparisons
Source:R/bioccheck_roxygen_fixes.R, R/viz_related.R
get_deg_count_donutplot.RdDonut chart of DEG counts (Up/Down) across comparisons
Arguments
- x
A
VISTAobject containing DEG summaries.- sample_comparisons
Optional character vector of comparison names to display.
- label
Label mode:
"both"(default),"count","percent", or"none".- label_digits
Integer number of decimals used for percentage labels.
- base_size
Numeric base font size for the plot.
- colors
Named vector giving fill colors for
"Up"and"Down"slices. Whenshow_other = TRUE, an"Other"entry may also be supplied.- show_other
Logical; when
TRUE, include non-DE genes as an"Other"slice usingother_colorunless overridden incolors.- other_color
Fill colour used for the
"Other"slice whenshow_other = TRUEandcolorsdoes not include"Other".- text_color
Colour used for donut label text.
- facet_by
Either
"comparison"(default) to draw one donut per comparison, or"none"for a single donut.- ncol
Optional number of columns when faceting.
Examples
v <- example_vista()
p <- get_deg_count_donutplot(v)
print(p)