Displays selected genes as grouped summary bars or individual sample-level
bars. By default, expression is summarized per group with mean ± SD bars.
With by = "sample", each sample is drawn separately.
Usage
get_expression_barplot(
  x,
  genes,
  sample_group = NULL,
  group_column = NULL,
  log_transform = TRUE,
  stats_group = FALSE,
  facet_scale = "free_y",
  facet_scales = facet_scale,
  facet_nrow = NULL,
  facet_ncol = NULL,
  p.label = "p.signif",
  comparisons = NULL,
  display_id = NULL,
  display_from = NULL,
  display_orgdb = NULL,
  by = c("group", "sample"),
  sample_order = c("input", "group", "expression"),
  fill_by = NULL,
  facet_by = c("auto", "gene", "none")
)
Arguments
- x
A
VISTAobject.- genes
Character vector (<=25 genes) to plot.
- sample_group
Optional character vector of groups (from
group_column) to include.- group_column
Optional column name in
sample_infoto use for grouping samples.- log_transform
Logical; log2-transform expression before plotting.
- stats_group
Logical; add statistical comparisons between groups when
TRUE.- facet_scale
Scaling option passed to
facet_wrap()(deprecated; usefacet_scales).- facet_scales
Facet scales argument passed to
facet_wrap()when faceting by gene.- facet_nrow, facet_ncol
Optional layout passed to
facet_wrap()when faceting.- p.label
Label format for
ggpubr::stat_compare_means().- comparisons
Optional list of specific group comparisons for
stat_compare_means().- display_id
Optional ID/column name to use for labels/facets. If supplied and present in
rowData(x), those values are used; otherwise falls back to ID mapping.- display_from
Optional source ID type for mapping (used when
display_idis not found inrowData).- display_orgdb
Optional
OrgDbobject used for ID mapping whendisplay_idis set but not found inrowData.- by
One of
"group"(default; summarize replicates by group) or"sample"(show one bar per sample).- sample_order
Ordering used when
by = "sample":"input"preserves the current sample order,"group"groups samples bygroup_column, and"expression"ranks samples by mean expression across the selected genes.- fill_by
Fill mapping for
by = "sample"barplots. Use"group"(default) or any discrete column from the joined plotting data, such as a sample metadata column or"sample". Group-summary barplots (by = "group") only support group-based fill because each bar already represents an aggregated group mean.- facet_by
Faceting mode:
"auto"(default; facet by gene when more than one gene is requested),"gene", or"none". For multiple genes,"none"falls back to"gene"to preserve readability.
Examples
# Create VISTA object
data("count_data", package = "VISTA")
data("sample_metadata", package = "VISTA")
vista <- create_vista(
counts = count_data[seq_len(200), ],
sample_info = sample_metadata[seq_len(6), ],
column_geneid = "gene_id",
group_column = "cond_long",
group_numerator = "treatment1",
group_denominator = "control"
)
#> estimating size factors
#> estimating dispersions
#> gene-wise dispersion estimates
#> mean-dispersion relationship
#> final dispersion estimates
#> fitting model and testing
# Plot expression for select genes
genes <- rownames(vista)[seq_len(3)]
get_expression_barplot(vista, genes = genes)
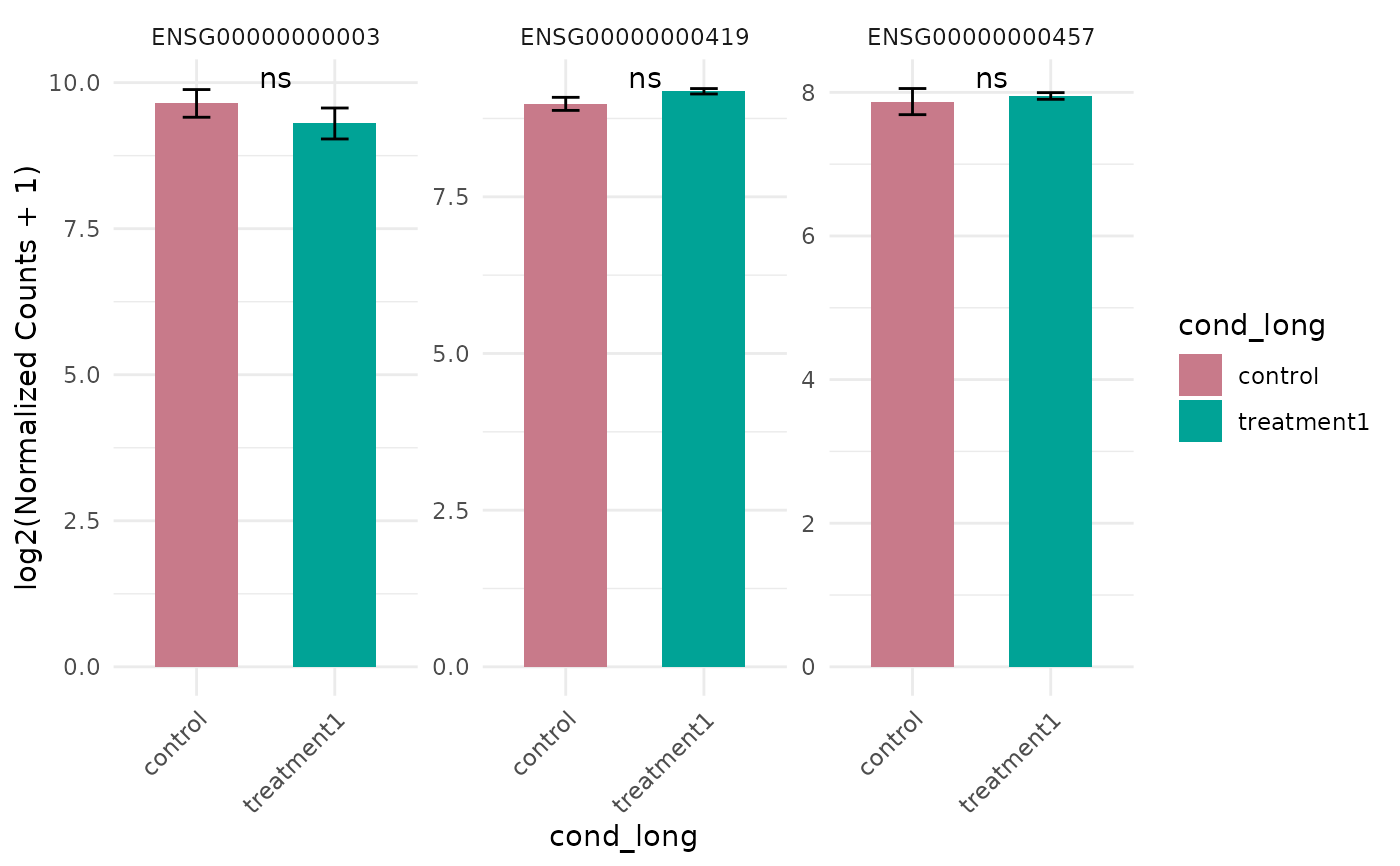
 # With statistics
get_expression_barplot(vista, genes = genes, stats_group = TRUE)
# With statistics
get_expression_barplot(vista, genes = genes, stats_group = TRUE)
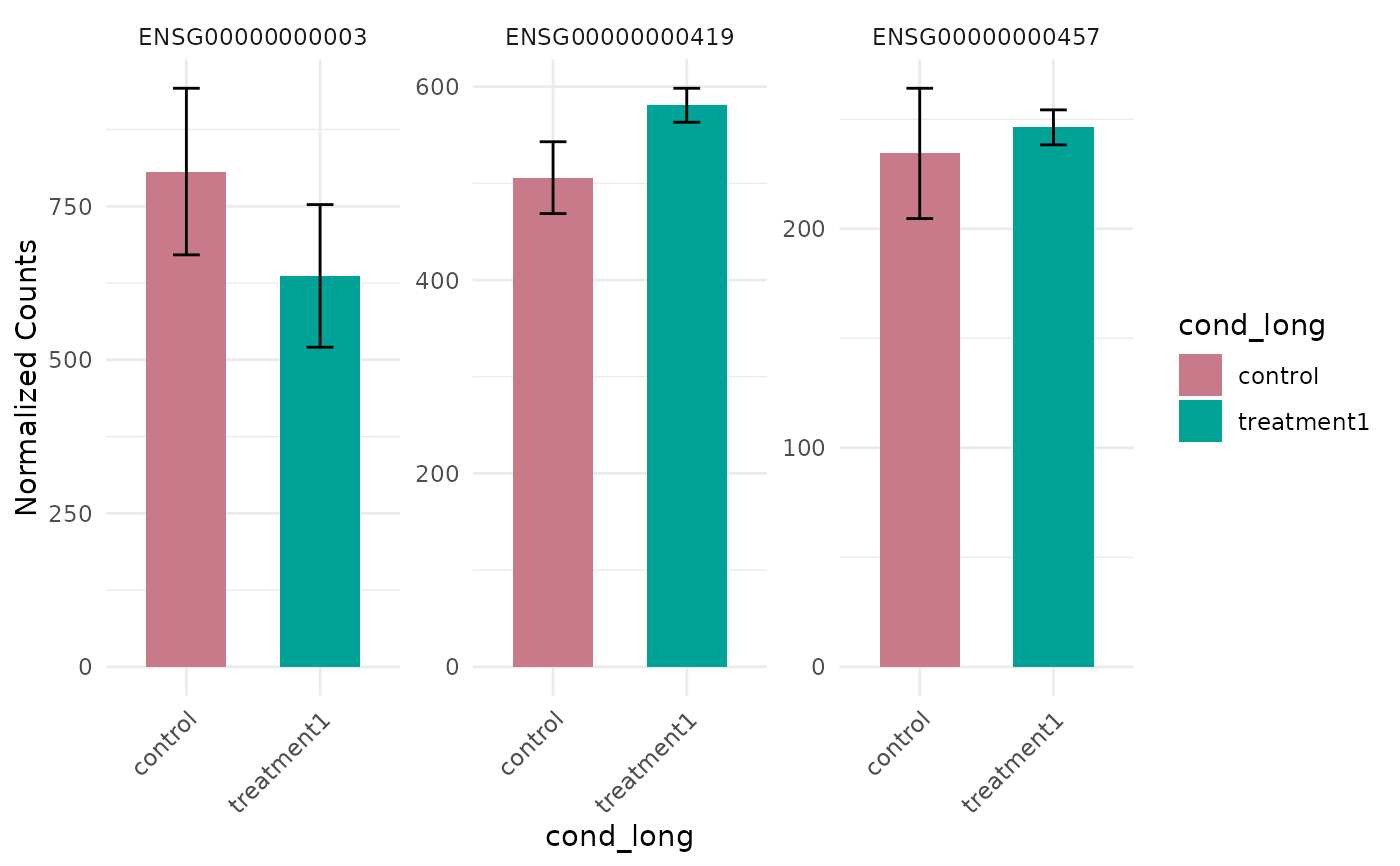
 # Without log transformation
get_expression_barplot(vista, genes = genes, log_transform = FALSE)
# Without log transformation
get_expression_barplot(vista, genes = genes, log_transform = FALSE)