Plot expression distributions as density curves
Source:R/bioccheck_roxygen_fixes.R, R/viz_related.R
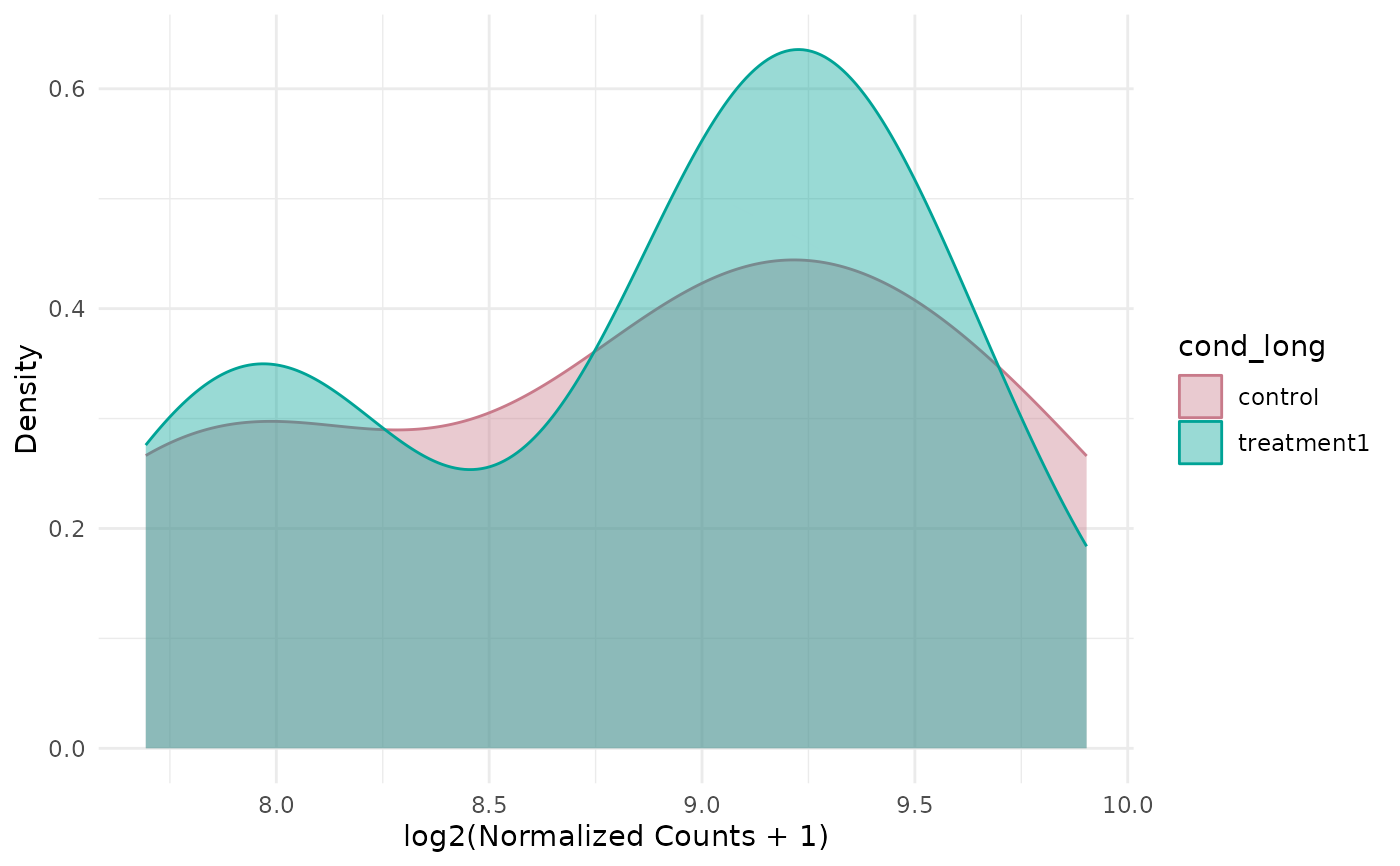
get_expression_density.RdShows expression distributions pooled across the selected genes, coloured by group (or sample), with optional faceting by group or sample.
Usage
get_expression_density(
  x,
  genes = NULL,
  sample_group = NULL,
  group_column = NULL,
  log_transform = TRUE,
  facet_scales = "free",
  facet_nrow = NULL,
  facet_ncol = NULL,
  alpha = 0.4,
  adjust = 1,
  color_by = c("group", "sample"),
  facet_by = c("none", "group", "sample"),
  sample_order = c("input", "group", "expression"),
  palette = NULL,
  colors = NULL
)
Arguments
- x
A
VISTAobject.- genes
Optional character vector of genes to display. Defaults to all genes.
- sample_group
Optional character vector specifying which groups (as defined by
group_column) to include.- group_column
Optional column name in
sample_infoused as the grouping variable.- log_transform
Logical; apply log2(x + 1) transform before plotting.
- facet_scales
Facet scales argument passed to
facet_wrap()(default"free").- facet_nrow, facet_ncol
Optional layout passed to
facet_wrap()when faceting.- alpha
Numeric transparency for density fill.
- adjust
Bandwidth adjustment factor passed to
geom_density().- color_by
Either
"group"(default) or"sample"to choose fill/color variable.- facet_by
One of
"none"(default),"group", or"sample"to facet densities.- sample_order
Ordering for sample-level display:
"input","group", or"expression".- palette
Optional qualitative palette name used when generating colours.
- colors
Optional named character vector of manual colours overriding
palette.
Examples
v <- example_vista()
genes <- head(rownames(v), 3)
p <- get_expression_density(v, genes = genes)
print(p)