Plot expression distributions as ridgelines
Source:R/bioccheck_roxygen_fixes.R, R/viz_related.R
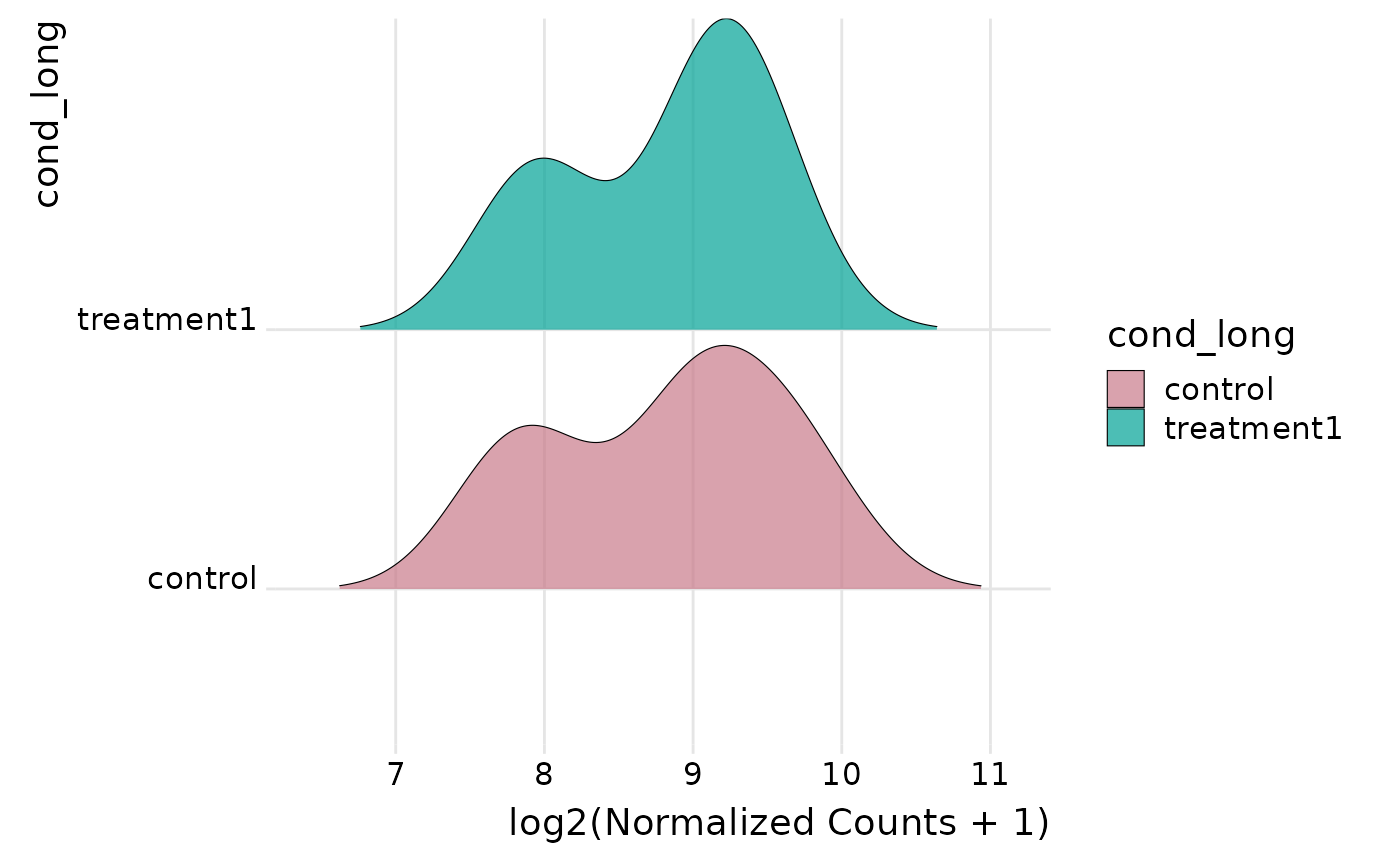
get_expression_joyplot.RdShows per-group (or per-sample) expression distributions pooled across the selected genes using ridge (joy) plots. Genes are pooled; no faceting to keep shapes comparable.
Arguments
- x
A
VISTAobject.- genes
Optional character vector of genes to display. Defaults to all genes.
- sample_group
Optional character vector specifying which groups (as defined by
group_column) to include.- group_column
Optional column name in
sample_infoused as the grouping variable.- log_transform
Logical; apply log2(x + 1) transform before plotting.
- alpha
Numeric transparency for fills.
- scale
Numeric scaling factor for ridges (passed to
geom_density_ridges()).- y_by
Either
"group"(default) or"sample"to choose the y-axis (ridge) grouping.- color_by
Either
"group"(default) or"sample"to choose fill colors.- sample_order
Ordering for sample-level display:
"input","group", or"expression".- palette
Optional qualitative palette name used when generating colours.
- colors
Optional named character vector of manual colours overriding
palette.
Examples
v <- example_vista()
genes <- head(rownames(v), 3)
p <- get_expression_joyplot(v, genes = genes)
print(p)
#> Picking joint bandwidth of 0.422