Gene expression line plot
Source:R/bioccheck_roxygen_fixes.R, R/viz_related.R
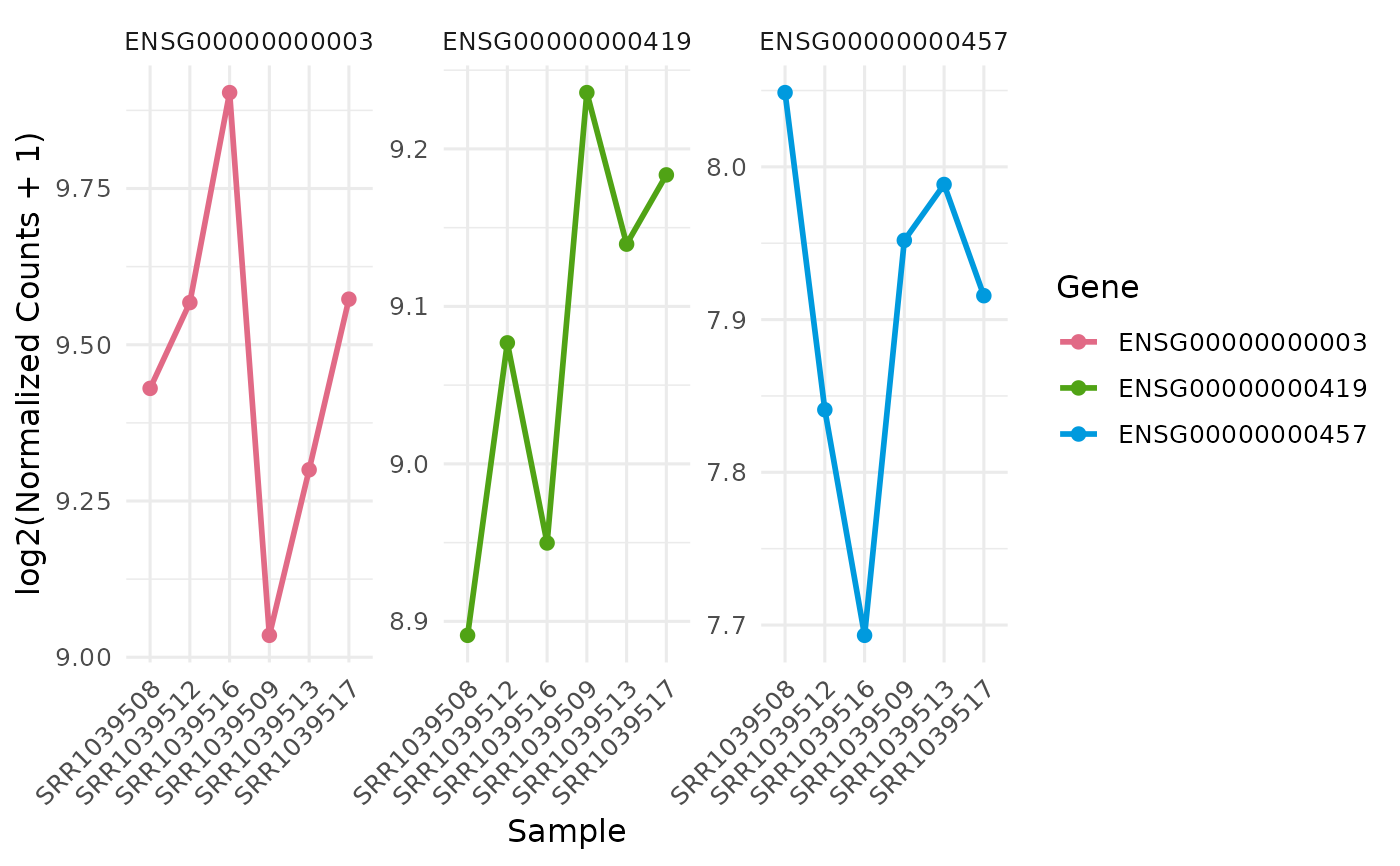
get_expression_lineplot.RdPlots normalized expression for selected genes across samples or summarized groups with optional transformations and group faceting.
Usage
get_expression_lineplot(
  x,
  genes = NULL,
  sample_group = NULL,
  group_column = NULL,
  log_transform = TRUE,
  display_id = NULL,
  display_from = NULL,
  display_orgdb = NULL,
  facet_scales = "free_y",
  facet_nrow = NULL,
  facet_ncol = NULL,
  stats_group = FALSE,
  p.label = "p.signif",
  comparisons = NULL,
  pool_genes = FALSE,
  by = c("sample", "group"),
  facet_by = c("auto", "group", "gene", "none"),
  fill_by = NULL,
  sample_order = c("input", "group", "expression"),
  value_transform = NULL,
  palette = NULL,
  colors = NULL,
  line_width = 1,
  point_size = 2,
  base_size = 12
)
Arguments
- x
A
VISTAobject.- genes
Character vector of gene identifiers to plot.
- sample_group
Optional character vector specifying which groups (values taken from
group_column) to include.- group_column
Optional column name in
sample_infodefining the grouping/faceting variable.- log_transform
Logical; log2-transform expression values before plotting.
- display_id
Optional ID/column name to use for gene labels. If supplied and present in
rowData(x), those values are used.- display_from
Optional source ID type for mapping (reserved for compatibility with other expression plotting APIs).
- display_orgdb
Optional
OrgDbobject used for ID mapping whendisplay_idis set but not found inrowData.- facet_scales
Scaling option passed to
facet_wrap().- facet_nrow, facet_ncol
Optional layout passed to
facet_wrap()when faceting.- stats_group
Logical retained for API consistency. Statistical overlays are not currently added by
get_expression_lineplot().- p.label
Label format retained for API consistency with other expression plots.
- comparisons
Optional list of comparisons retained for API consistency.
- pool_genes
Logical; when
TRUE, average the selected genes into a single trajectory.- by
Plot unit:
"sample"(default) or"group"to average replicates before plotting.- facet_by
Faceting mode:
"auto"(default),"none","group", or"gene".- fill_by
Argument retained for API consistency; ignored because line plots use colour rather than fill.
- sample_order
Ordering used for sample-level plots:
"input","group", or"expression".- value_transform
Deprecated compatibility alias for transformation choice; one of
"log2","zscore", or"none".- palette
Optional qualitative palette name used for gene colours.
- colors
Optional named character vector of manual gene colours.
- line_width
Line width.
- point_size
Point size.
- base_size
Base theme size.
Examples
v <- example_vista()
genes <- head(rownames(v), 3)
p <- get_expression_lineplot(v, genes = genes)
print(p)