Plot expression as a lollipop chart
Source:R/bioccheck_roxygen_fixes.R, R/viz_related.R
get_expression_lollipop.RdDisplays selected genes as stem-and-dot (lollipop) plots. By default,
expression is summarized per group (mean across replicates). With
by = "sample", the plot shows individual samples.
Usage
get_expression_lollipop(
  x,
  genes,
  sample_group = NULL,
  group_column = NULL,
  by = c("group", "sample"),
  sample_order = c("input", "group", "expression"),
  facet_by = c("auto", "gene", "none"),
  log_transform = TRUE,
  facet_scale = "free_y",
  facet_nrow = NULL,
  facet_ncol = NULL,
  point_size = 6,
  line_size = 1.2,
  label = TRUE,
  label_digits = 1,
  display_id = NULL,
  display_from = NULL,
  display_orgdb = NULL
)
Arguments
- x
A
VISTAobject.- genes
Character vector (<=15 genes) to plot.
- sample_group
Optional character vector of groups (from
group_column) to include.- group_column
Optional column name in
sample_infoto use for grouping samples.- by
One of
"group"(default; summarize replicates by group) or"sample"(show individual samples).- sample_order
Ordering used when
by = "sample":"input"preserves the current sample order,"group"groups samples bygroup_column, and"expression"ranks samples by mean expression across the selected genes.- facet_by
Faceting mode:
"auto"(default; facet by gene when more than one gene is requested),"gene", or"none". For multiple genes,"none"falls back to"gene"to avoid unreadable combined panels.- log_transform
Logical; log2-transform expression before plotting.
- facet_scale
Scaling option passed to
facet_wrap()when plotting multiple genes.- facet_nrow, facet_ncol
Optional layout passed to
facet_wrap()when faceting.- point_size
Numeric size of the dots.
- line_size
Numeric size of the stems.
- label
Logical; draw numeric labels above the dots.
- label_digits
Integer; digits to show in labels when
label = TRUE.- display_id
Optional ID/column name to use for labels/facets. If supplied and present in
rowData(x), those values are used; otherwise falls back to ID mapping.- display_from
Optional source ID type for mapping (used when
display_idis not found inrowData).- display_orgdb
Optional
OrgDbobject used for ID mapping whendisplay_idis set but not found inrowData.
Examples
v <- example_vista()
genes <- head(rownames(v), 5)
p <- get_expression_lollipop(v, genes = genes)
print(p)
 data("count_data", package = "VISTA")
data("sample_metadata", package = "VISTA")
vista <- create_vista(
counts = count_data[seq_len(200), ],
sample_info = sample_metadata[seq_len(6), ],
column_geneid = "gene_id",
group_column = "cond_long",
group_numerator = "treatment1",
group_denominator = "control"
)
#> estimating size factors
#> estimating dispersions
#> gene-wise dispersion estimates
#> mean-dispersion relationship
#> final dispersion estimates
#> fitting model and testing
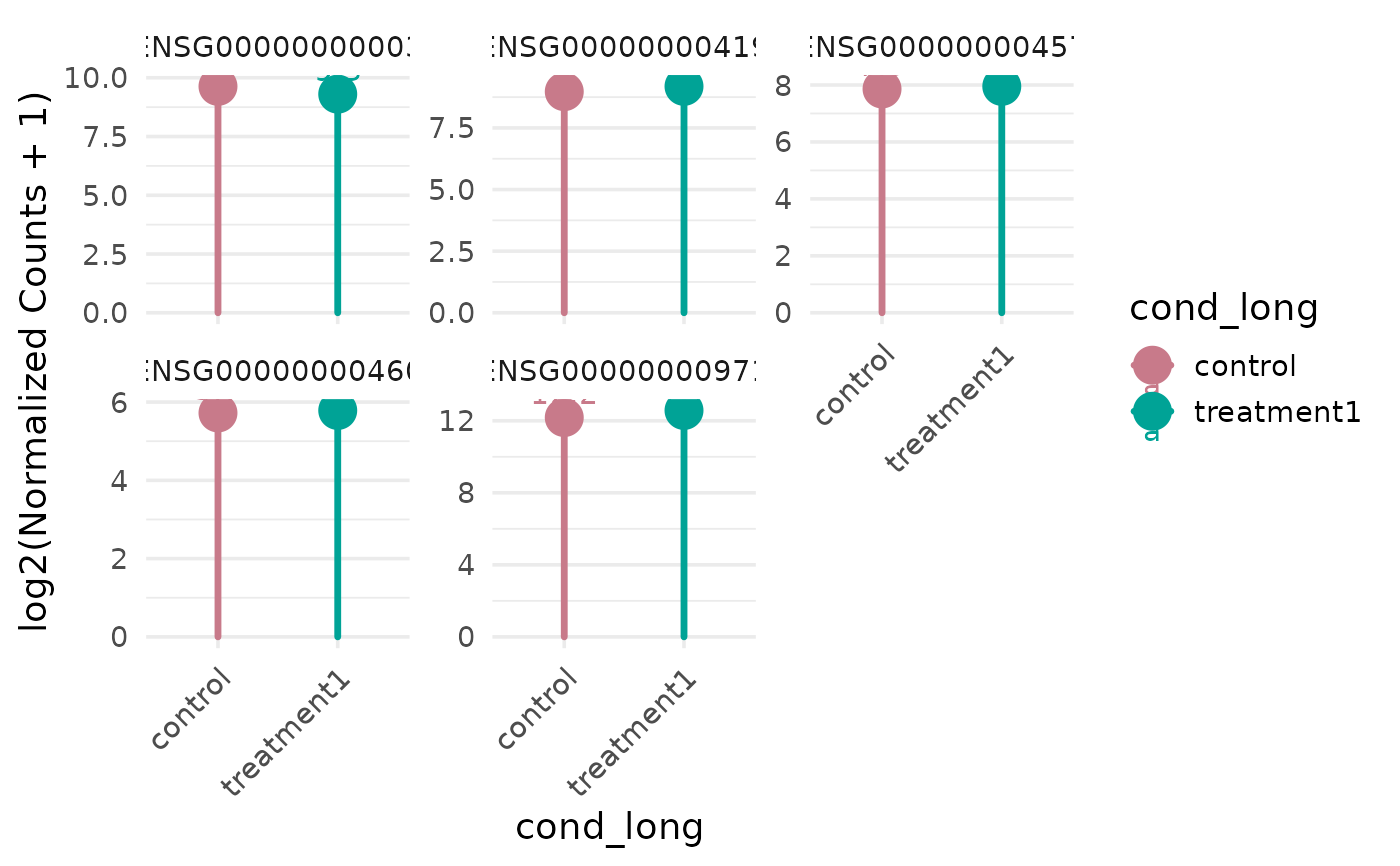
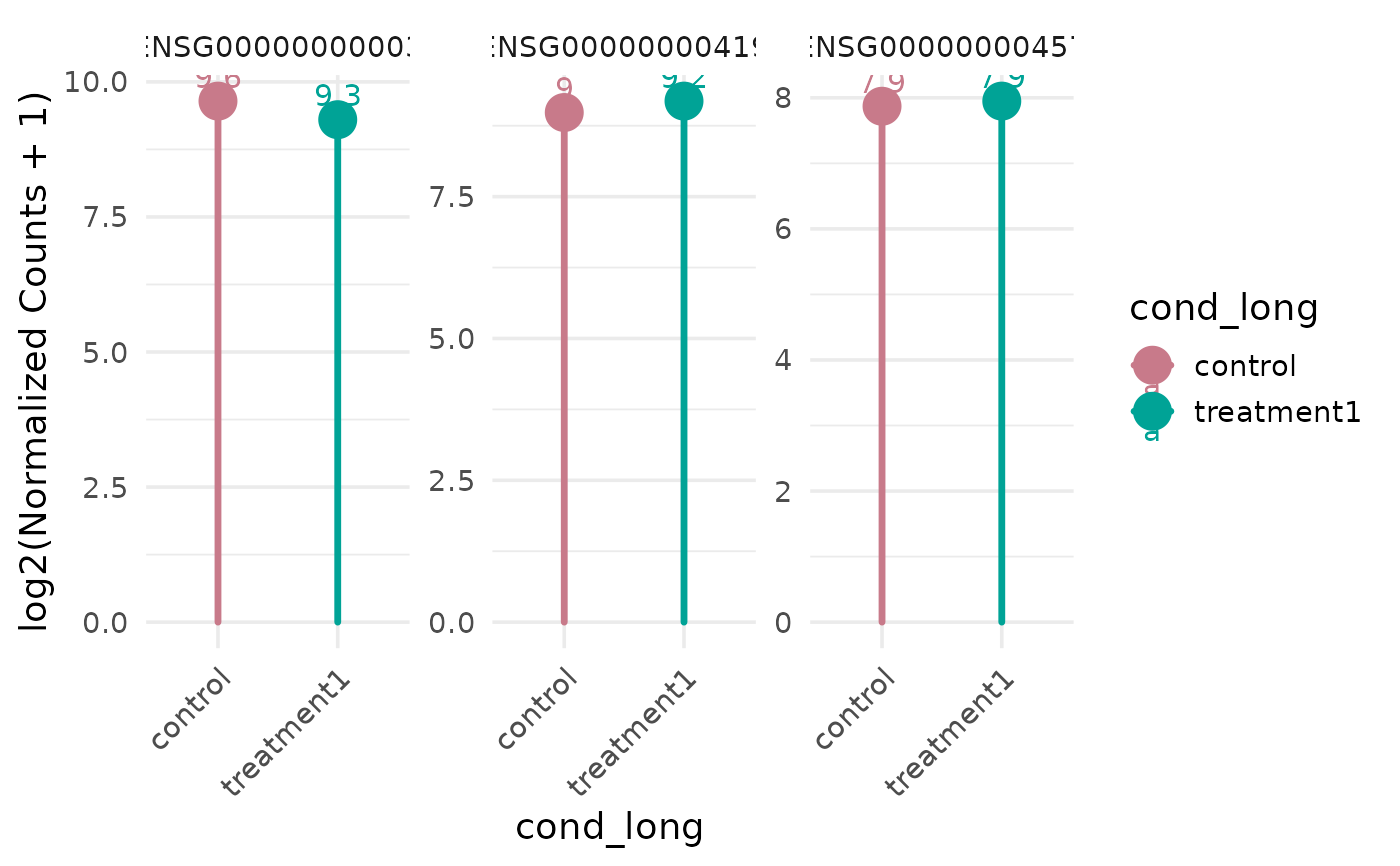
genes <- rownames(vista)[seq_len(3)]
get_expression_lollipop(vista, genes = genes)
data("count_data", package = "VISTA")
data("sample_metadata", package = "VISTA")
vista <- create_vista(
counts = count_data[seq_len(200), ],
sample_info = sample_metadata[seq_len(6), ],
column_geneid = "gene_id",
group_column = "cond_long",
group_numerator = "treatment1",
group_denominator = "control"
)
#> estimating size factors
#> estimating dispersions
#> gene-wise dispersion estimates
#> mean-dispersion relationship
#> final dispersion estimates
#> fitting model and testing
genes <- rownames(vista)[seq_len(3)]
get_expression_lollipop(vista, genes = genes)
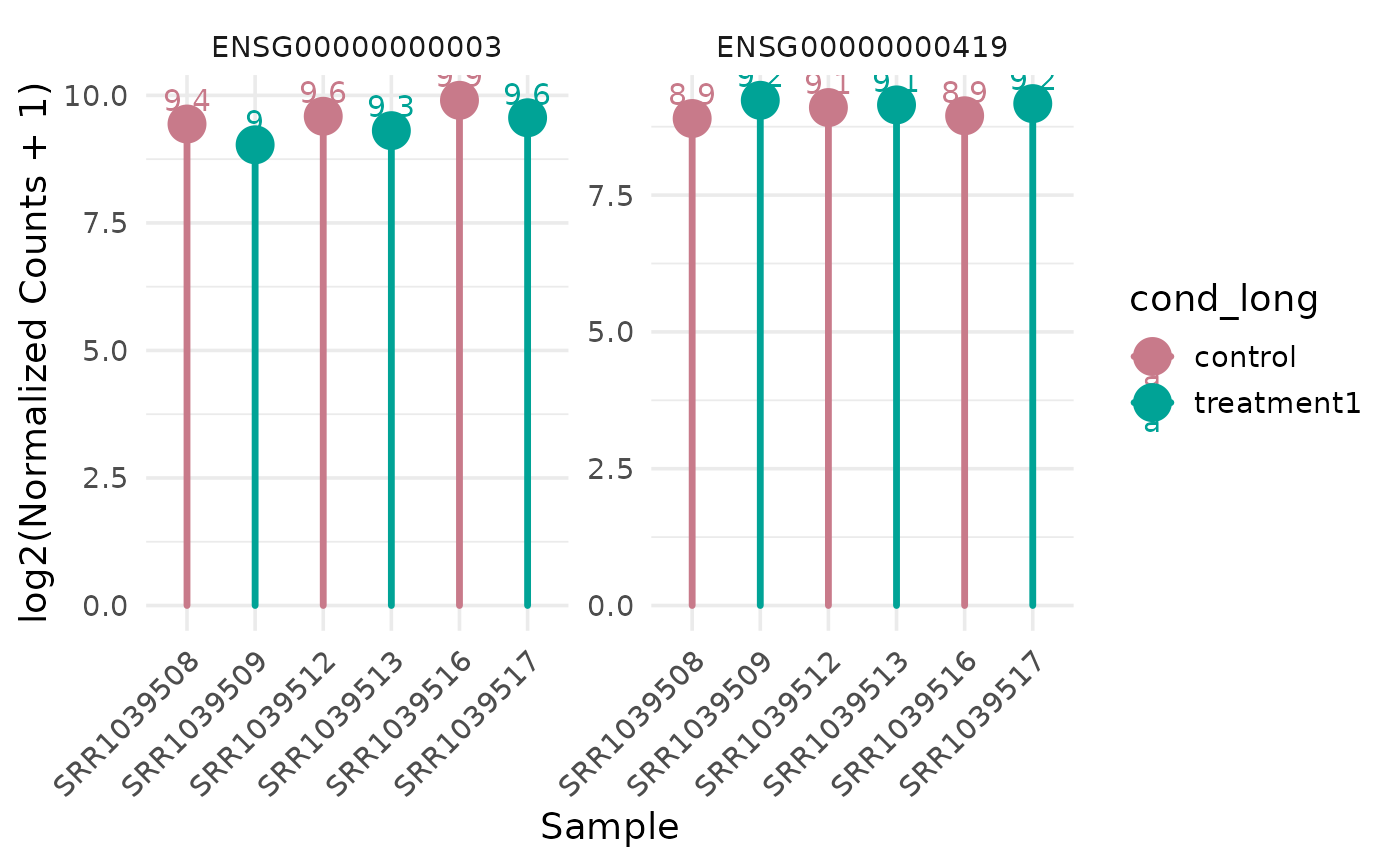
 get_expression_lollipop(vista, genes = genes[seq_len(2)], by = "sample")