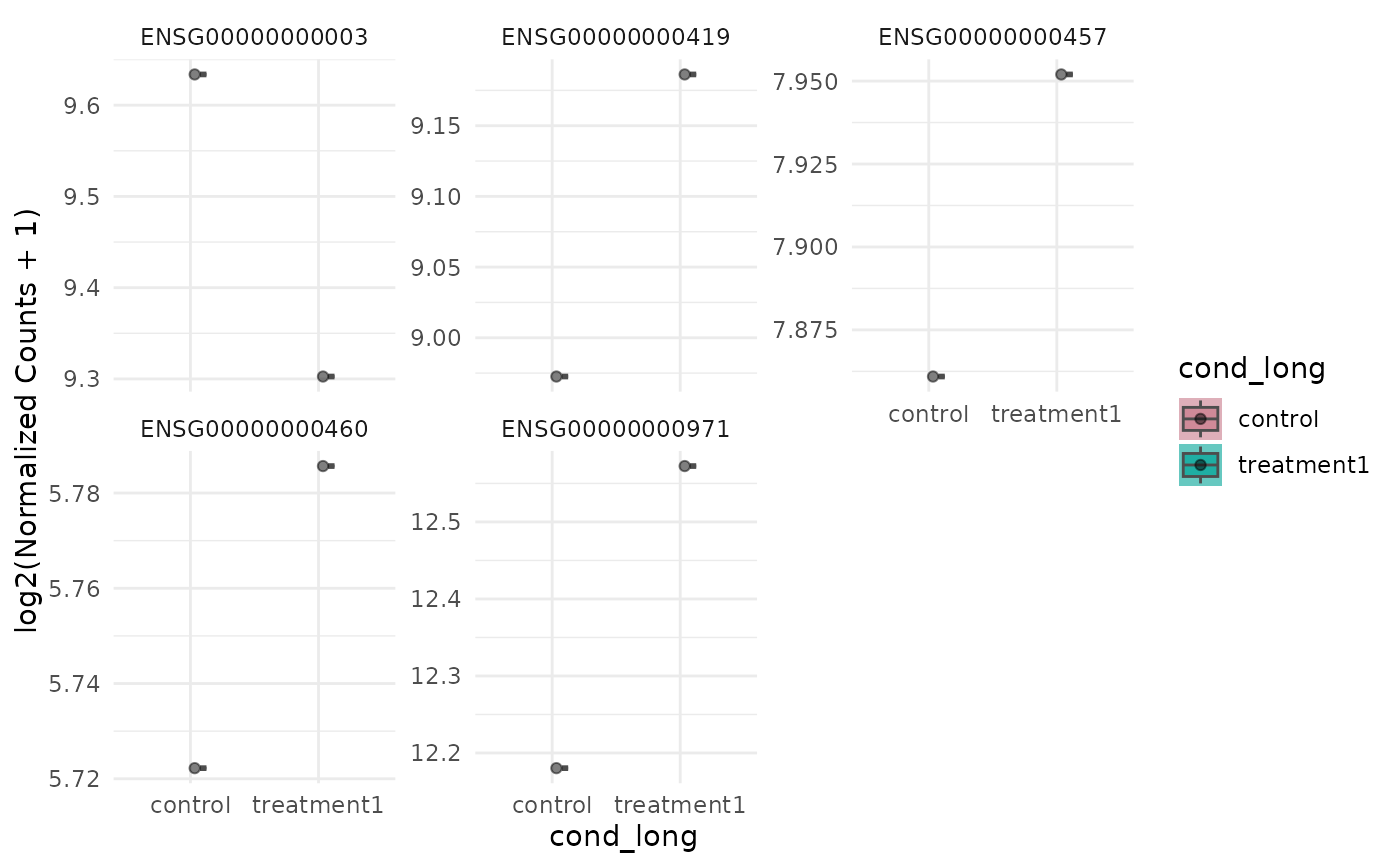
Raincloud plot of expression values
Source:R/bioccheck_roxygen_fixes.R, R/viz_related.R
get_expression_raincloud.RdUses ggrain::geom_rain() to combine a half-violin, boxplot, and jittered
points per sample/group to show distribution, summary, and individual values.
Usage
get_expression_raincloud(
  x,
  genes = NULL,
  sample_group = NULL,
  group_column = NULL,
  by = "group",
  value_transform = c("log2", "zscore", "none"),
  summarise = FALSE,
  facet_by = c("auto", "gene", "none"),
  fill_by = NULL,
  facet_nrow = NULL,
  facet_ncol = NULL,
  sample_order = c("input", "group", "expression"),
  rain_side = c("r", "l", "f", "f1x1", "f2x2"),
  id.long.var = NULL,
  alpha = 0.5,
  point_size = 1.5,
  p.label = "p.signif",
  stats_group = FALSE,
  stats_method = "t.test",
  label = FALSE,
  label_column = "gene",
  label_size = 3,
  label_max_overlaps = 50,
  display_id = NULL,
  display_from = NULL,
  display_orgdb = NULL
)
Arguments
- x
A
VISTAobject.- genes
Optional character vector of gene IDs to include; defaults to all genes selected by the plotting mode.
- sample_group
Optional subset of groups (values of
group_column) to keep.- group_column
Grouping column in
sample_info; defaults to the stored grouping.- by
Plot unit. Violin plots currently support only
"group".- value_transform
Deprecated compatibility alias.
"log2"maps tolog_transform = TRUE,"none"maps toFALSE, and"zscore"applies a per-gene z-score transform.- summarise
Logical; when
TRUE, collapse replicates within each group for each gene (one value per gene per group). This is useful for pooled multi-gene raincloud plots where each dot represents one gene-level summary in a group.- facet_by
Faceting mode. Uses the same argument pattern as
get_expression_boxplot(), butpool_genes = TRUEfalls back to"none"because pooled violins already aggregate across genes.- fill_by
Fill mapping. Uses the same values as
get_expression_boxplot(), including discrete sample metadata columns.- facet_nrow, facet_ncol
Optional layout passed to
facet_wrap()when faceting.- sample_order
Ordering for sample-level display before values are grouped into violins.
- rain_side
Side specification passed to
ggrain::geom_rain(); one of"r","l","f","f1x1", or"f2x2".- id.long.var
Optional column name passed to
ggrain::geom_rain()asid.long.varto identify repeated measurements.- alpha
Alpha for jittered points.
- point_size
Point size for jittered points.
- p.label
Label type passed to
ggpubr::stat_compare_means().- stats_group
Logical; add pairwise statistical tests when
TRUE.- stats_method
Statistical method passed to
ggpubr::stat_compare_means().- label
Logical; add text labels to points using
ggrepel.- label_column
Column name in the plotting data used for labels. Defaults to
"gene"for expression raincloud plots.- label_size
Text size for point labels.
- label_max_overlaps
Maximum overlaps passed to
ggrepel::geom_text_repel().- display_id
Optional ID/column name to use for labels. If supplied and present in
rowData(x), those values are used; otherwise falls back to ID mapping.- display_from
Optional source ID type for mapping (used when
display_idis not found inrowData).- display_orgdb
Optional
OrgDbobject used for ID mapping whendisplay_idis set but not found inrowData.
Details
id.long.var controls which repeated unit is connected by lines in
ggrain::geom_rain().
Recommended usage for expression raincloud plots:
id.long.var = NULL(default): best for clean distribution summaries.id.long.var = "gene": best when plotting a small number of genes and showing gene-level trajectories across x levels.id.long.var = "<subject_id_column>": best for paired/repeated-measure designs when a subject ID exists insample_info.id.long.var = "sample"or the grouping variable is usually less informative and can over-connect points.Point labels (
label = TRUE) work best withfacet_by = "none"or a small number of genes.
For identifier display consistency with other VISTA plotting functions, set
display_id (for example, "SYMBOL"). When provided, genes can be given
in that ID space, and default point labels use the mapped display IDs.
Examples
v <- example_vista()
genes <- head(rownames(v), 5)
p <- get_expression_raincloud(v, genes = genes, summarise = TRUE)
#> Warning: `summarise = TRUE` with `facet_by = 'gene'` gives one summarized value per
#> group in each facet, so raincloud distributions are not informative. Consider
#> `facet_by = 'none'` with `id.long.var = 'gene'`.
print(p)
#> Warning: Groups with fewer than two datapoints have been dropped.
#> ℹ Set `drop = FALSE` to consider such groups for position adjustment purposes.
#> Warning: Groups with fewer than two datapoints have been dropped.
#> ℹ Set `drop = FALSE` to consider such groups for position adjustment purposes.
#> Warning: no non-missing arguments to max; returning -Inf
#> Warning: Computation failed in `stat_half_ydensity()`.
#> Caused by error in `$<-.data.frame`:
#> ! replacement has 1 row, data has 0
#> Warning: Groups with fewer than two datapoints have been dropped.
#> ℹ Set `drop = FALSE` to consider such groups for position adjustment purposes.
#> Warning: Groups with fewer than two datapoints have been dropped.
#> ℹ Set `drop = FALSE` to consider such groups for position adjustment purposes.
#> Warning: no non-missing arguments to max; returning -Inf
#> Warning: Computation failed in `stat_half_ydensity()`.
#> Caused by error in `$<-.data.frame`:
#> ! replacement has 1 row, data has 0