Compare normalized expression between two samples or groups
Source:R/bioccheck_roxygen_fixes.R, R/viz_related.R
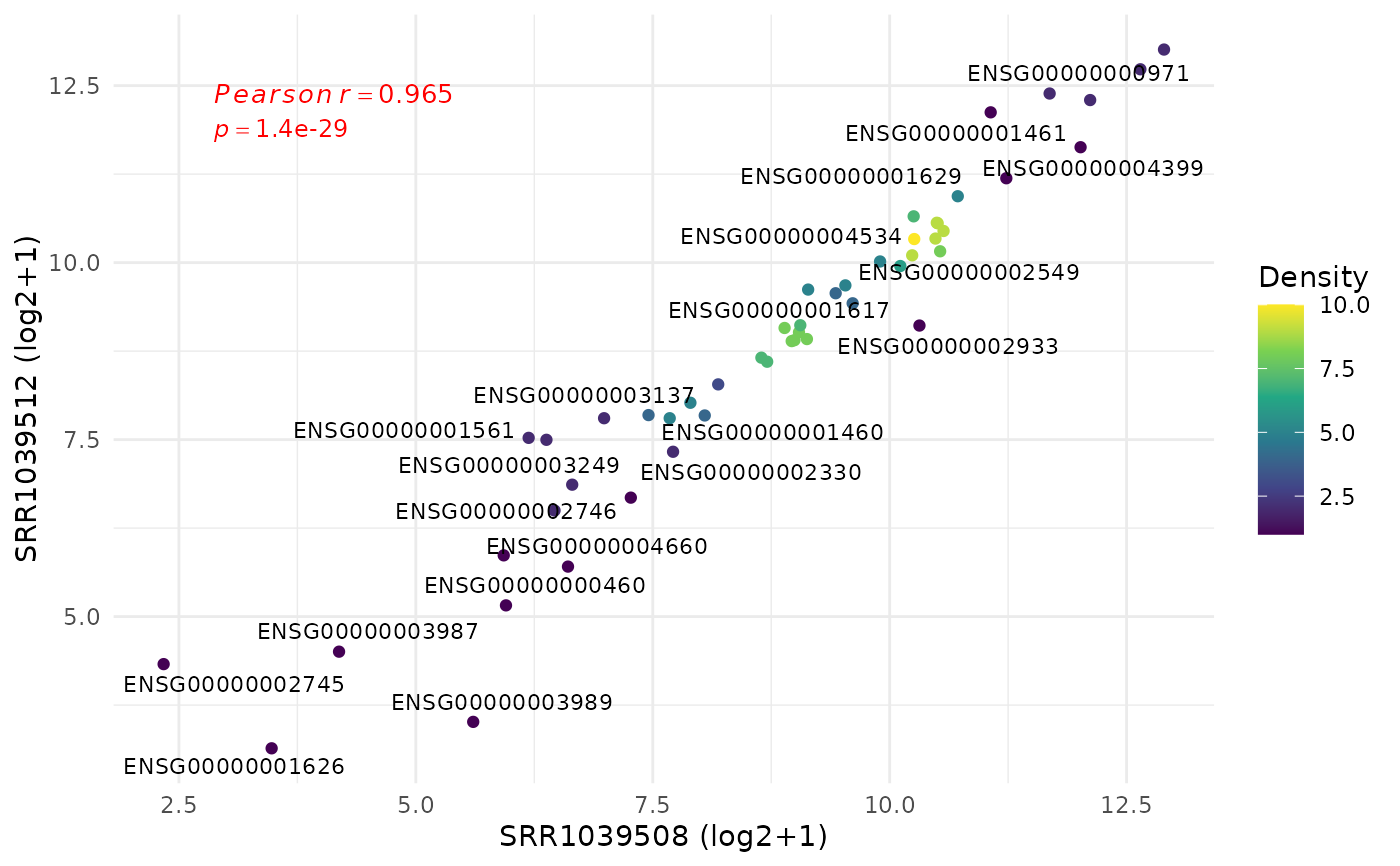
get_expression_scatter.RdPlots gene-level expression for two selected samples or group means, colours points by local density (viridis), labels the most divergent genes, and reports Pearson/Spearman correlation.
Arguments
- x
A
VISTAobject.- sample_x
First sample or group to plot (character scalar).
- sample_y
Second sample or group to plot (character scalar).
- by
One of
"sample"(use individual samples) or"group"(average replicates withingroup_columnbefore plotting). Default"sample".- group_column
Column in
sample_infoused whenby = "group"(defaults to stored grouping column).- genes
Optional character vector of genes to include; defaults to all.
- log_transform
Logical; apply log2(x + 1) transform. Default
TRUE.- label_n
Integer; number of most divergent genes to label (ranked by |x - y|). Set to 0 to disable labels.
- label_size
Numeric size for labeled genes.
- method
Correlation method for the subtitle;
"pearson"(default) or"spearman".- display_id
Optional column in
rowData(x)to use for point labels (fallback to gene_id/rownames when not available).
Examples
v <- example_vista()
si <- as.data.frame(sample_info(v))
genes <- head(rownames(v), 50)
p <- get_expression_scatter(
  v,
  sample_x = si$sample_names[1],
  sample_y = si$sample_names[2],
  genes = genes
)
print(p)