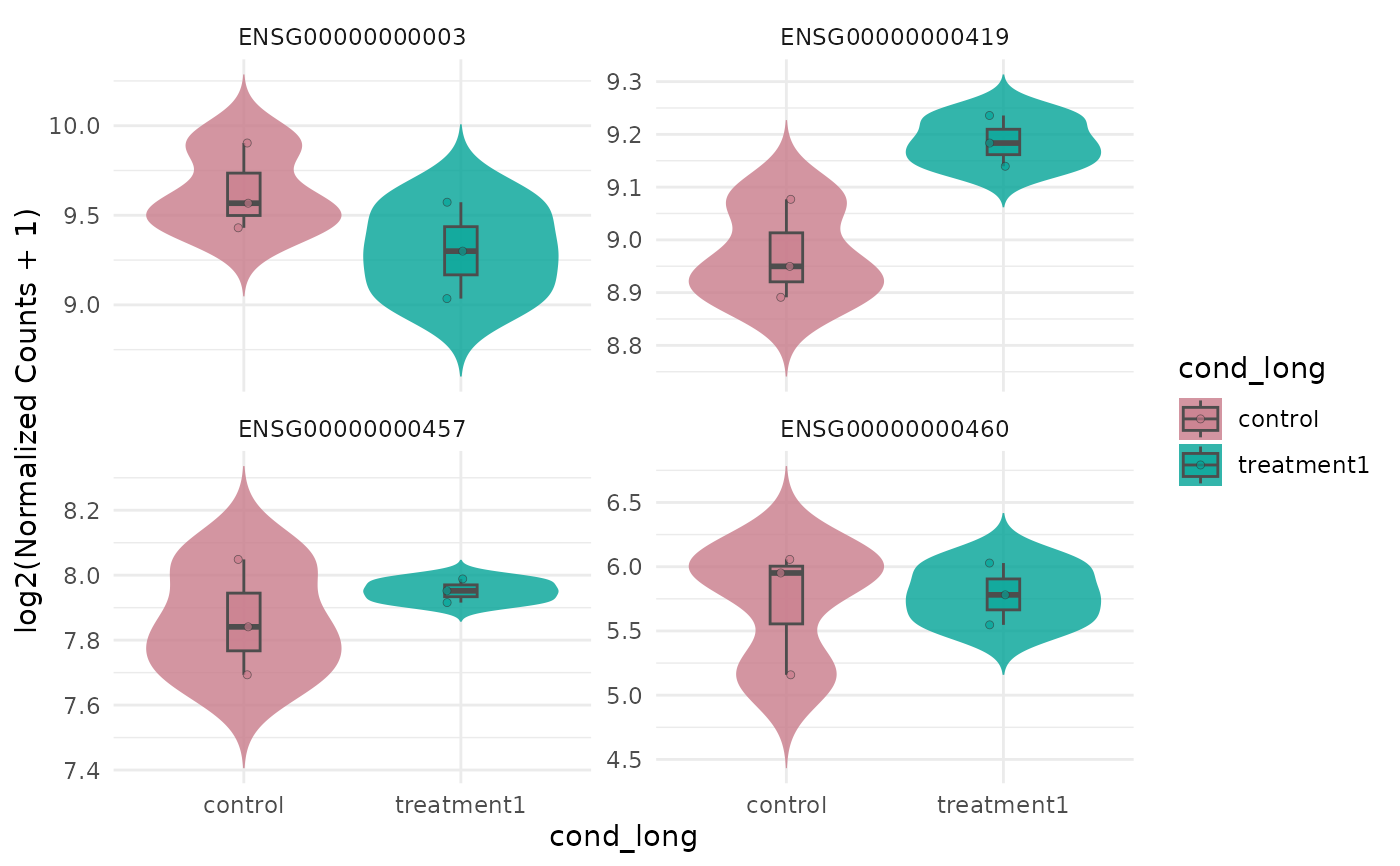
Violin plot of expression values
Source:R/bioccheck_roxygen_fixes.R, R/viz_related.R
get_expression_violinplot.RdMirrors the main user-facing arguments of get_expression_boxplot() so the
two geoms can be swapped with minimal code changes. Violin plots currently
keep group-based semantics (by = "group") because a violin requires
replicate-level distributions within groups rather than one value per sample.
Usage
get_expression_violinplot(
  x,
  genes = NULL,
  sample_group = NULL,
  group_column = NULL,
  log_transform = TRUE,
  display_id = NULL,
  display_from = NULL,
  display_orgdb = NULL,
  facet_scales = "free_y",
  facet_nrow = NULL,
  facet_ncol = NULL,
  stats_group = FALSE,
  p.label = "p.signif",
  comparisons = NULL,
  pool_genes = FALSE,
  by = "group",
  facet_by = c("auto", "gene", "none"),
  fill_by = NULL,
  sample_order = c("input", "group", "expression"),
  value_transform = NULL,
  summarise = FALSE
)
Arguments
- x
A
VISTAobject.- genes
Optional character vector of gene IDs to include; defaults to all genes selected by the plotting mode.
- sample_group
Optional subset of groups (values of
group_column) to keep.- group_column
Grouping column in
sample_info; defaults to the stored grouping.- log_transform
Logical; log2-transform expression values before plotting.
- display_id
Optional ID/column name to use for labels/facets. If supplied and present in
rowData(x), those values are used.- display_from
Optional source ID type for mapping (reserved for compatibility with
get_expression_boxplot()).- display_orgdb
Optional
OrgDbobject used for ID mapping whendisplay_idis set but not found inrowData(reserved for compatibility withget_expression_boxplot()).- facet_scales
Scaling option passed to
facet_wrap().- facet_nrow, facet_ncol
Optional layout passed to
facet_wrap()when faceting.- stats_group
Logical; add statistical comparisons between groups when
TRUE.- p.label
Label format for
ggpubr::stat_compare_means().- comparisons
Optional list of specific group comparisons for
stat_compare_means().- pool_genes
Logical; pool all selected genes into one violin per group.
- by
Plot unit. Violin plots currently support only
"group".- facet_by
Faceting mode. Uses the same argument pattern as
get_expression_boxplot(), butpool_genes = TRUEfalls back to"none"because pooled violins already aggregate across genes.- fill_by
Fill mapping. Uses the same values as
get_expression_boxplot(), including discrete sample metadata columns.- sample_order
Ordering for sample-level display before values are grouped into violins.
- value_transform
Deprecated compatibility alias.
"log2"maps tolog_transform = TRUE,"none"maps toFALSE, and"zscore"applies a per-gene z-score transform.- summarise
Logical retained for compatibility. Violin plots always use replicate-level values, so
summarise = TRUEis ignored with a warning.
Examples
v <- example_vista()
genes <- head(rownames(v), 4)
p <- get_expression_violinplot(v, genes = genes)
print(p)