Plot fold-change barplots across comparisons for selected genes
Source:R/bioccheck_roxygen_fixes.R, R/viz_related.R
get_foldchange_barplot.RdPlots log2 fold changes for selected genes across one or more comparisons.
facet_by controls per-gene or per-comparison layout explicitly.
Usage
get_foldchange_barplot(
  x,
  genes,
  sample_comparisons = NULL,
  coord_flip = FALSE,
  display_id = NULL,
  display_from = NULL,
  display_orgdb = NULL,
  sort_by = c("input", "log2fc", "abs_log2fc"),
  facet_scales = "free_y",
  facet_nrow = NULL,
  facet_ncol = NULL,
  facet_by = c("auto", "gene", "comparison", "none")
)
Arguments
- x
A
VISTAobject containing differential expression results.- genes
Character vector of gene IDs to plot.
- sample_comparisons
Optional character vector of comparison names to include; defaults to all available.
- coord_flip
Logical; flip axes when
TRUE.- display_id
Optional column in
rowData(x)to use for gene labels. Input gene matching still usesgene_id.- display_from
Optional source ID type for mapping when
display_idis not present inrowData(x).- display_orgdb
Optional
OrgDbobject used for identifier mapping whendisplay_idis not present inrowData(x).- sort_by
How to order genes when faceting:
"input"(use supplied order),"log2fc"(descending log2FC of the first comparison), or"abs_log2fc"(descending max absolute log2FC across comparisons).- facet_scales
Facet scales argument passed to
facet_wrap()when faceting (default"free_y").- facet_nrow, facet_ncol
Optional layout passed to
facet_wrap()when faceting.- facet_by
Faceting mode:
"auto"(default),"gene","comparison", or"none".
Examples
v <- example_vista()
comp <- names(comparisons(v))[1]
genes <- head(as.character(comparisons(v)[[comp]]$gene_id), 10)
p <- get_foldchange_barplot(v, sample_comparison = comp, genes = genes)
print(p)
 data("count_data", package = "VISTA")
data("sample_metadata", package = "VISTA")
vista <- create_vista(
counts = count_data[seq_len(200), ],
sample_info = sample_metadata[seq_len(6), ],
column_geneid = "gene_id",
group_column = "cond_long",
group_numerator = "treatment1",
group_denominator = "control"
)
#> estimating size factors
#> estimating dispersions
#> gene-wise dispersion estimates
#> mean-dispersion relationship
#> final dispersion estimates
#> fitting model and testing
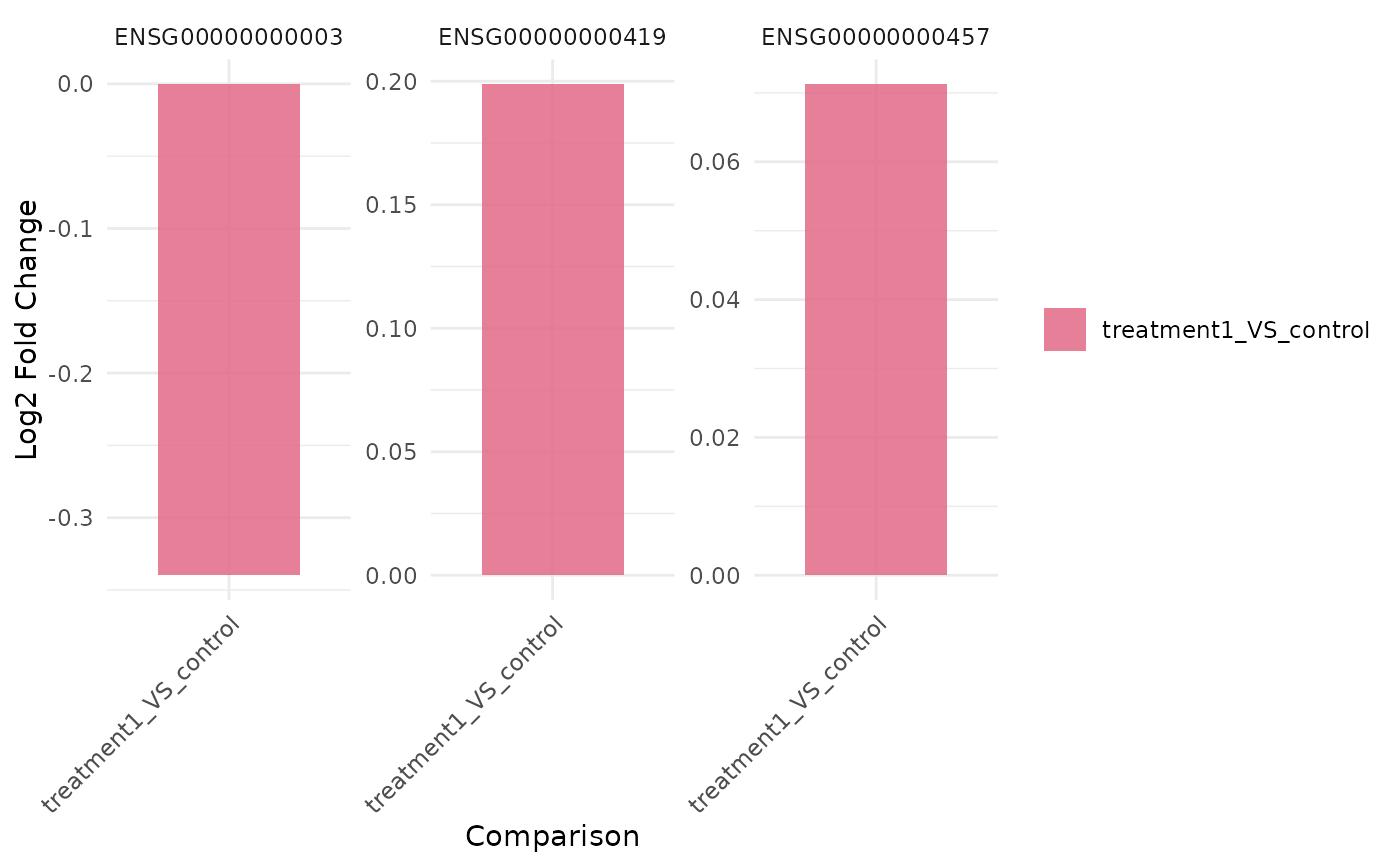
genes <- rownames(vista)[seq_len(3)]
get_foldchange_barplot(vista, genes = genes)
data("count_data", package = "VISTA")
data("sample_metadata", package = "VISTA")
vista <- create_vista(
counts = count_data[seq_len(200), ],
sample_info = sample_metadata[seq_len(6), ],
column_geneid = "gene_id",
group_column = "cond_long",
group_numerator = "treatment1",
group_denominator = "control"
)
#> estimating size factors
#> estimating dispersions
#> gene-wise dispersion estimates
#> mean-dispersion relationship
#> final dispersion estimates
#> fitting model and testing
genes <- rownames(vista)[seq_len(3)]
get_foldchange_barplot(vista, genes = genes)
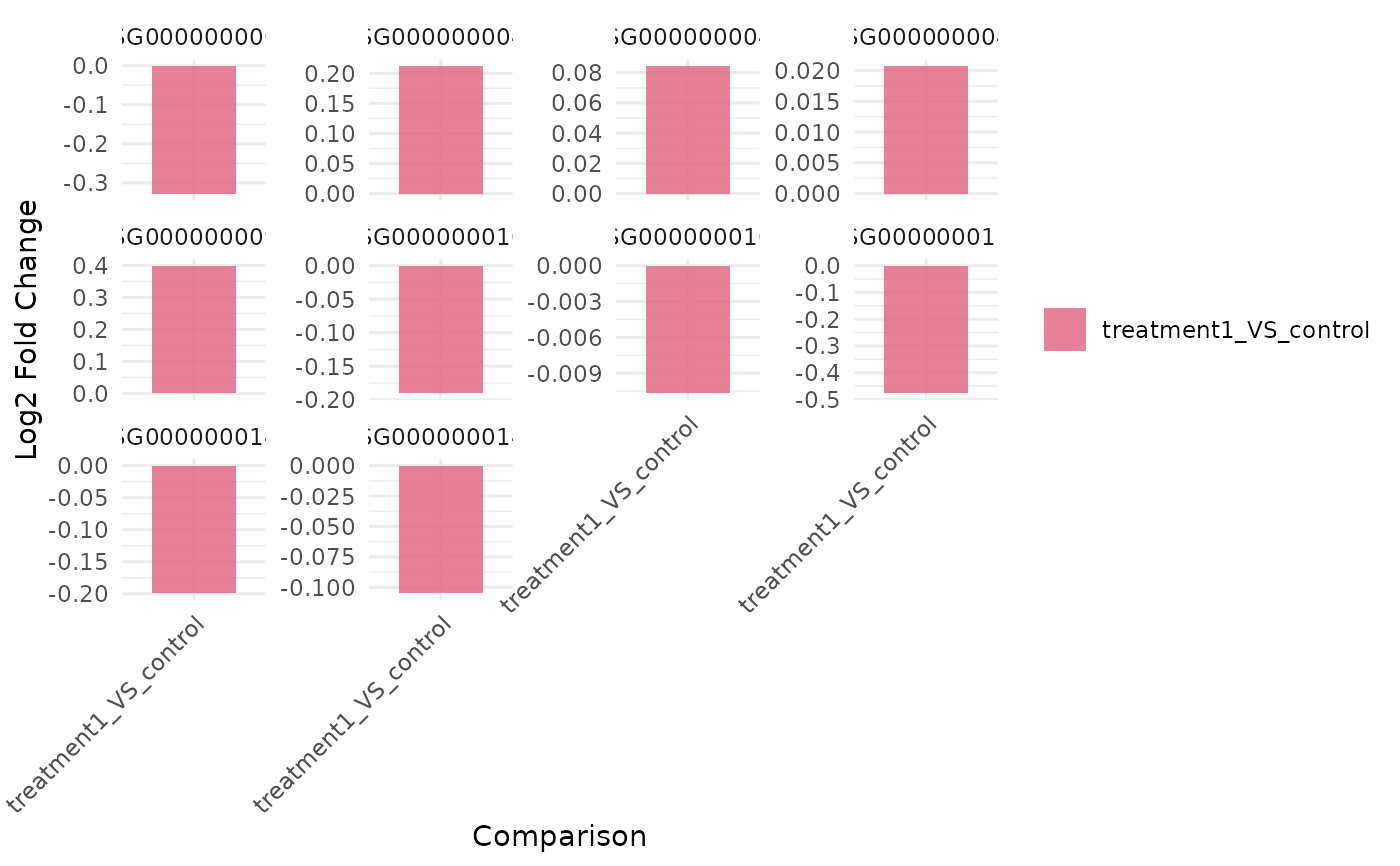
 get_foldchange_barplot(vista, genes = genes, facet_by = "gene")