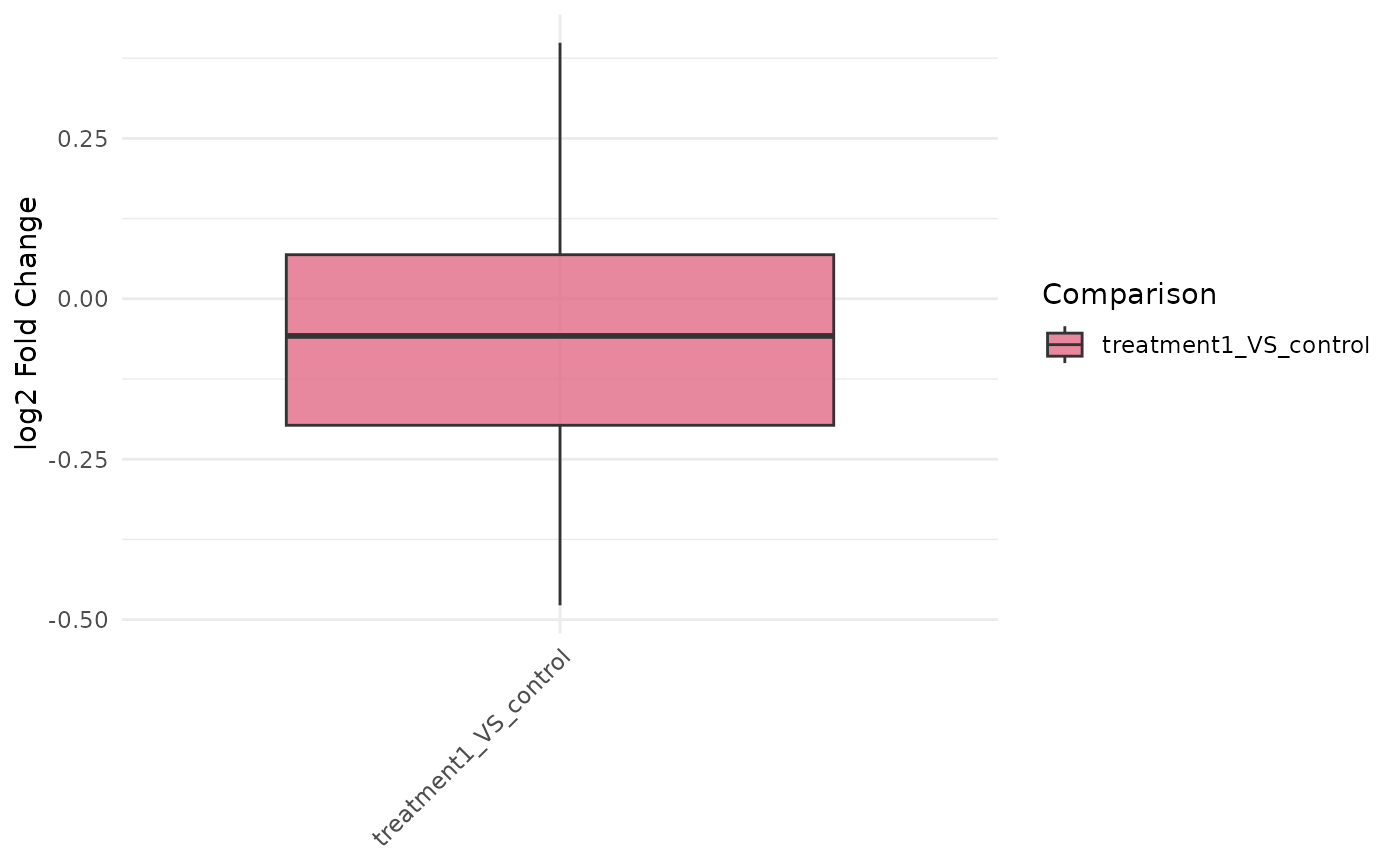
Plot fold-change distributions across comparisons
Source:R/bioccheck_roxygen_fixes.R, R/viz_related.R
get_foldchange_boxplot.RdBuilds boxplots of log2 fold changes for selected genes and comparisons, optionally adding statistics.
Usage
get_foldchange_boxplot(
  x,
  genes = NULL,
  sample_comparisons = NULL,
  display_id = NULL,
  display_from = NULL,
  display_orgdb = NULL,
  facet_scales = "free_x",
  facet_nrow = NULL,
  facet_ncol = NULL,
  facet_by = c("auto", "comparison", "none"),
  p.label = "p.signif",
  stats_group = FALSE,
  stats_method = "t.test"
)
Arguments
- x
A
VISTAobject containing differential expression results.- genes
Optional character vector of gene IDs to include.
- sample_comparisons
Optional character vector of comparison names to plot.
- display_id
Optional ID/column name used to interpret
genesand, when possible, map fold-change gene identifiers to display-friendly labels.- display_from
Optional source ID type for mapping when
display_idis not present inrowData(x).- display_orgdb
Optional
OrgDbobject used for identifier mapping whendisplay_idis not present inrowData(x).- facet_scales
Facet scales argument passed to
facet_wrap()whenfacet_by != "none"(default"free_x").- facet_nrow, facet_ncol
Optional layout passed to
facet_wrap()when faceting.- facet_by
Faceting mode:
"auto"(default),"comparison", or"none".- p.label
Label type passed to
ggpubr::stat_compare_means().- stats_group
Logical; add pairwise statistical tests when
TRUE.- stats_method
Statistical method passed to
ggpubr::stat_compare_means().
Examples
v <- example_vista()
comp <- names(comparisons(v))[1]
genes <- head(as.character(comparisons(v)[[comp]]$gene_id), 10)
p <- get_foldchange_boxplot(v, sample_comparison = comp, genes = genes)
print(p)