Visualizes log2 fold-change matrices across comparisons with
ComplexHeatmap, supporting clustering and annotations. With only a
VISTA object, the function will plot the top DE genes across the stored
comparisons.
Usage
get_foldchange_heatmap(
  x,
  sample_comparisons = NULL,
  genes = NULL,
  top_n = 10,
  display_id = NULL,
  display_from = NULL,
  display_orgdb = NULL,
  repair_genes = FALSE,
  show_row_names = NULL,
  label_size = 10,
  label_specific_rows = NULL,
  label_specific_rows_gp = grid::gpar(fontsize = 5),
  show_column_names = TRUE,
  cluster_rows = TRUE,
  show_row_dend = TRUE,
  cluster_columns = TRUE,
  kmeans_k = NULL,
  annotate_columns = FALSE,
  column_anno_palette = "Set2",
  color_default = TRUE,
  col = NULL,
  heatmap_name = NULL,
  show_heatmap_legend = TRUE,
  return_type = c("heatmap", "clusters", "both"),
  ...
)
Arguments
- x
A
VISTAobject with stored differential expression results.- sample_comparisons
Optional character vector of comparison names to include. Defaults to all available comparisons.
- genes
Optional character vector of gene identifiers to display. When omitted, VISTA selects the top DE genes from each comparison by absolute log2 fold-change.
- top_n
Integer number of genes to select per comparison when
genes = NULL. Defaults to10.- display_id
Optional ID/column name to use for plot labels. If supplied
- display_from
Optional source ID type for mapping (used when
display_id- display_orgdb
Optional
OrgDbobject used for ID mapping when- repair_genes
Logical; attempt to simplify
gene_idstrings by removing prefixes.- show_row_names
Logical; draw row (gene) names. When
NULL, VISTA turns labels on automatically for auto-selected genes.- label_size
Numeric font size for row names.
- label_specific_rows
Optional character vector of genes to highlight with
anno_mark().- label_specific_rows_gp
grid::gpar()object controlling highlighted labels.- show_column_names
Logical; draw column labels.
- cluster_rows
Logical; cluster rows.
- show_row_dend
Logical; display the row dendrogram.
- cluster_columns
Logical; cluster columns.
- kmeans_k
Optional integer specifying the number of k-means clusters for rows.
- annotate_columns
Logical; add annotation bars keyed to the sample grouping column.
- column_anno_palette
Qualitative palette name used for column annotations.
- color_default
Logical; use the default diverging palette when
TRUE. Set toFALSEto supplycol.- col
Optional
circlize::colorRamp2color function used whencolor_default = FALSE.- heatmap_name
Optional legend title.
- show_heatmap_legend
Logical; display the heatmap legend.
- return_type
"heatmap","clusters", or"both"selecting the returned value.- ...
Additional arguments forwarded to
ComplexHeatmap::Heatmap().
Value
An object returned by this function.
A ComplexHeatmap object, a cluster data frame, or a list containing
both depending on return_type.
Examples
v <- example_vista()
comp <- names(comparisons(v))[1]
genes <- unique(stats::na.omit(as.character(comparisons(v)[[comp]]$gene_id)))[seq_len(20)]
if (requireNamespace('ComplexHeatmap', quietly = TRUE) &&
requireNamespace('circlize', quietly = TRUE)) {
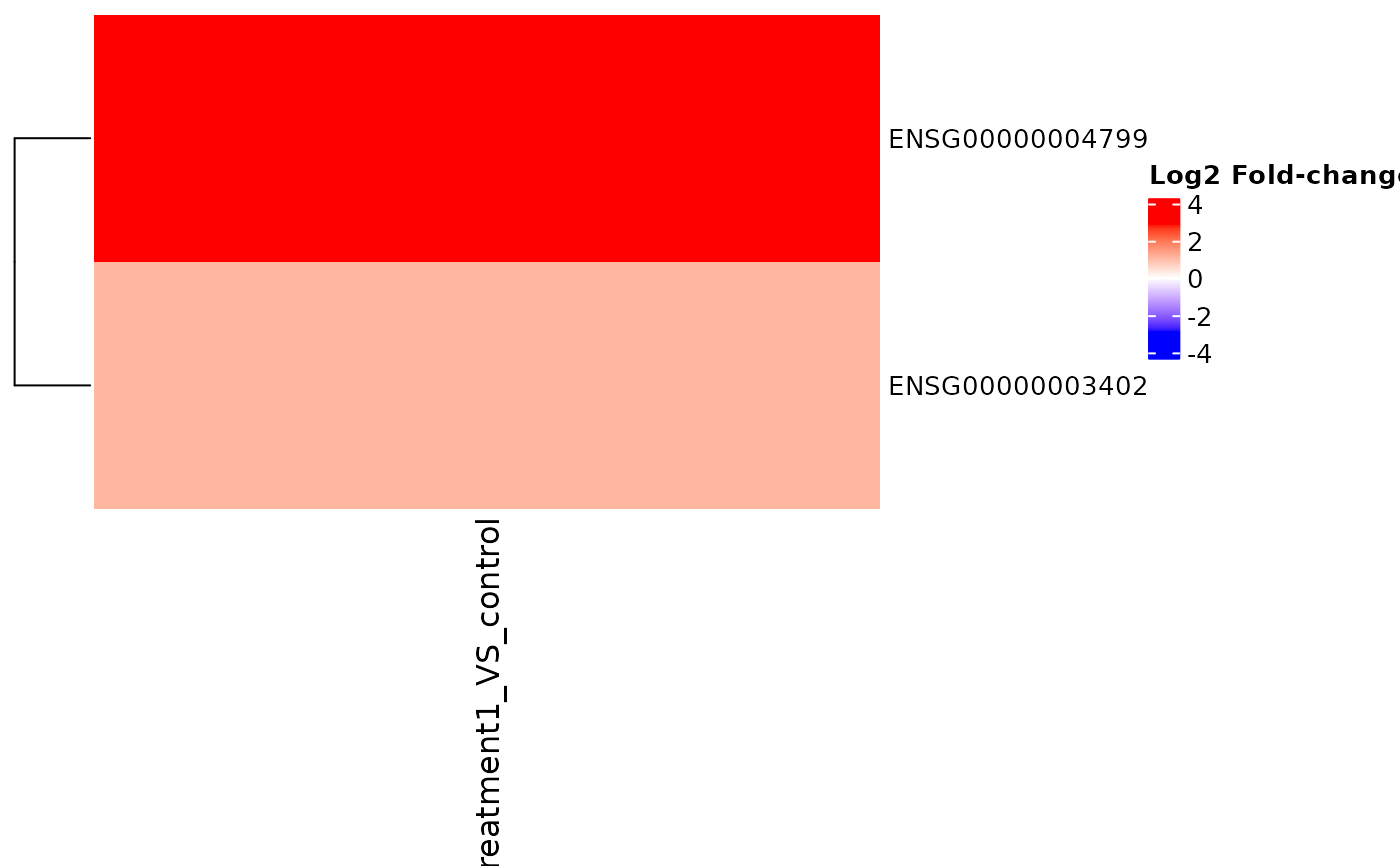
hm <- get_foldchange_heatmap(
v,
sample_comparisons = comp,
genes = genes,
return_type = 'heatmap'
)
ComplexHeatmap::draw(hm)
}
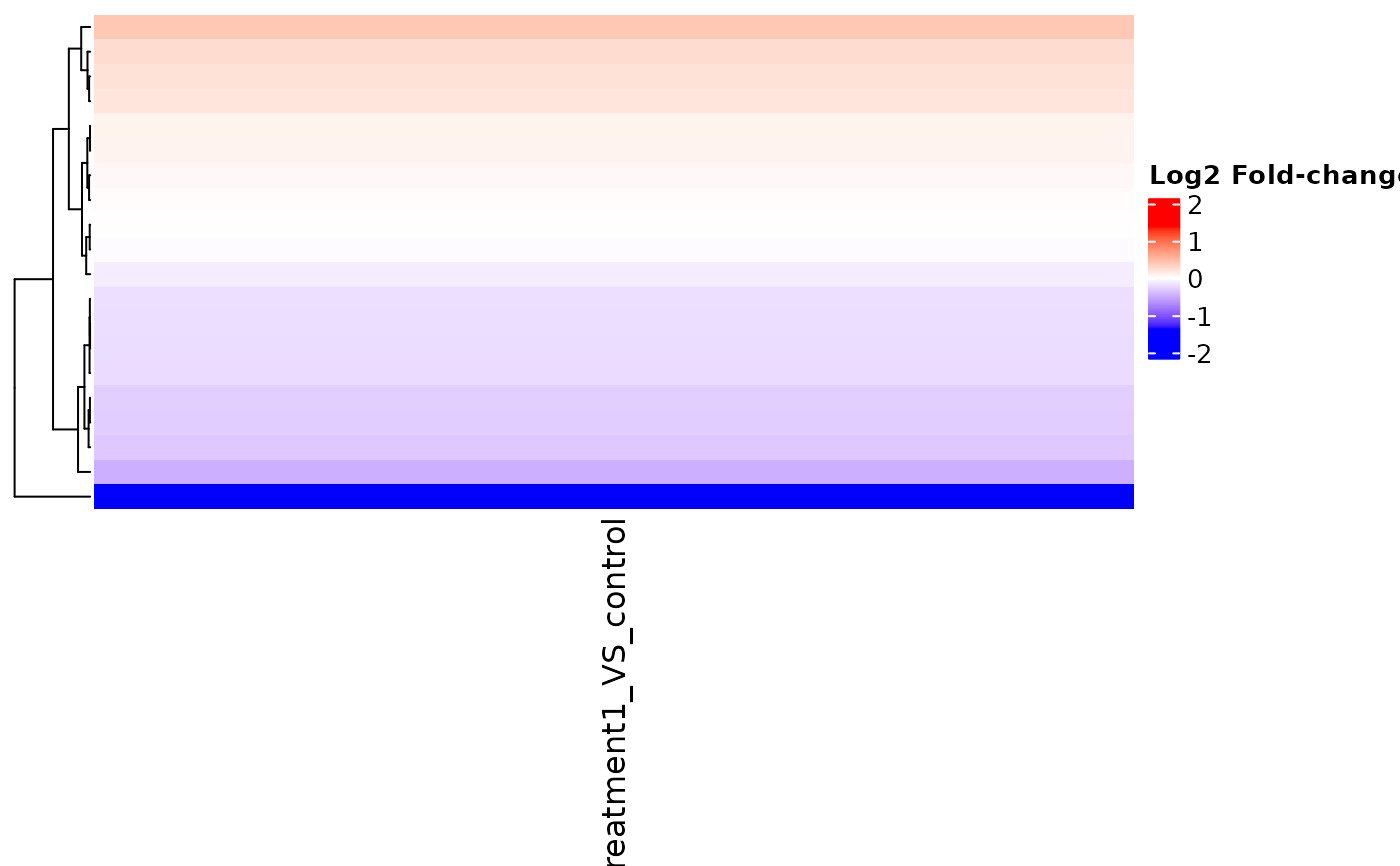 v <- example_vista()
if (requireNamespace("ComplexHeatmap", quietly = TRUE) &&
requireNamespace("circlize", quietly = TRUE)) {
hm <- get_foldchange_heatmap(v, return_type = "heatmap")
ComplexHeatmap::draw(hm)
}
v <- example_vista()
if (requireNamespace("ComplexHeatmap", quietly = TRUE) &&
requireNamespace("circlize", quietly = TRUE)) {
hm <- get_foldchange_heatmap(v, return_type = "heatmap")
ComplexHeatmap::draw(hm)
}