Generate an MDS plot for samples in a VISTA object
Source:R/bioccheck_roxygen_fixes.R, R/viz_related.R
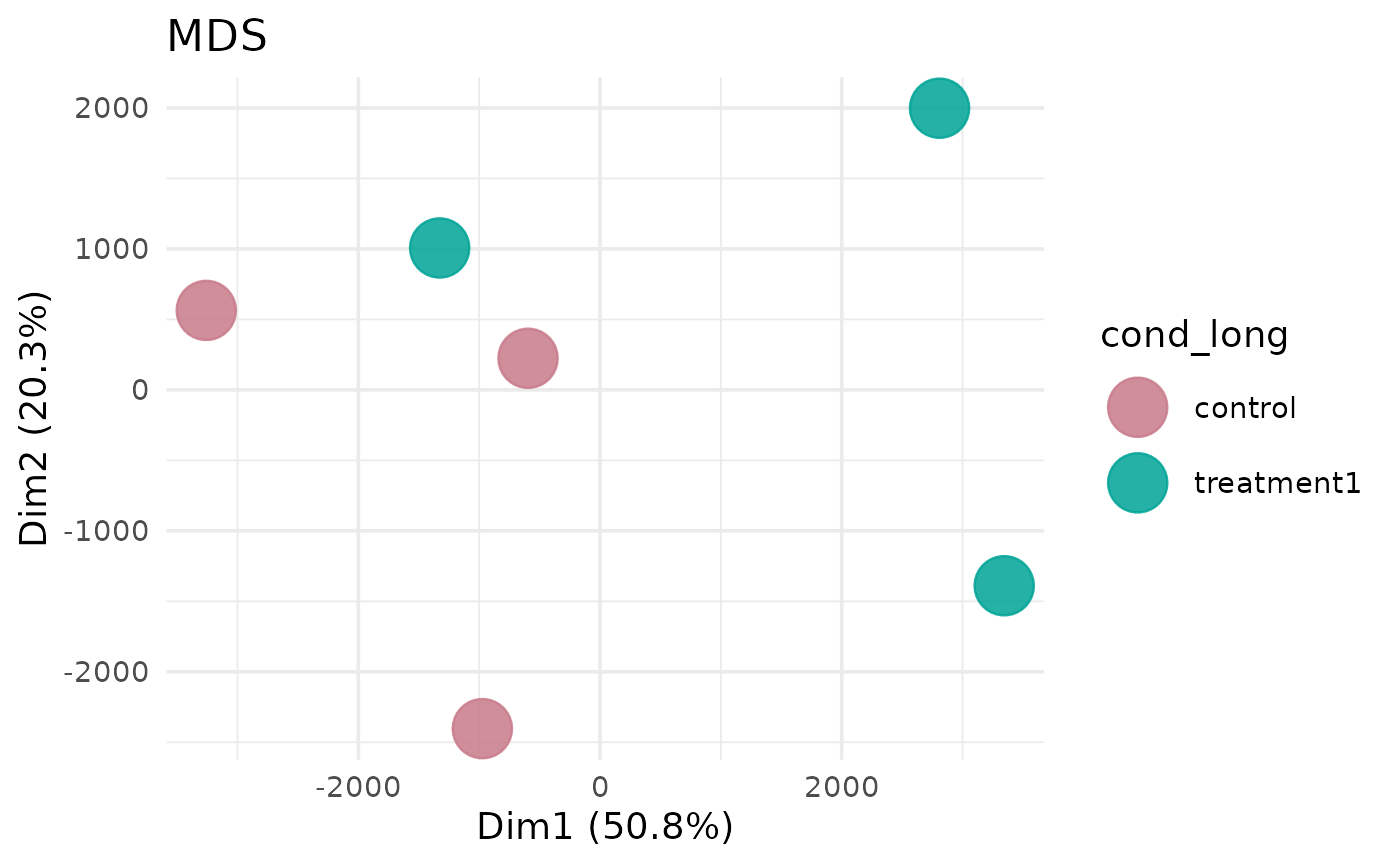
get_mds_plot.RdRuns classical multidimensional scaling on normalized counts, optionally restricting to groups or genes.
Usage
get_mds_plot(
  x,
  sample_group = NULL,
  group_column = NULL,
  genes = NULL,
  top_n_genes = NULL,
  label = FALSE,
  label_size = 3,
  point_size = 10,
  shape_by = NULL,
  shape_values = NULL,
  color_by = NULL,
  use_vista_colors = NULL,
  palette = NULL,
  colors = NULL,
  use_group_colors = TRUE
)
Arguments
- x
A
VISTAobject.- sample_group
Optional character vector of groups to include (based on the column specified by
group_column).- group_column
Optional column name in
sample_infoto use for grouping/filtering.- genes
Optional character vector of gene identifiers to restrict the matrix.
- top_n_genes
Optional integer selecting the top variable genes to include.
- label
Logical; draw sample labels when
TRUE.- label_size
Numeric size of sample labels when
label = TRUE.- point_size
Numeric size for points.
- shape_by
Optional column name in
sample_infoused to map point shape. WhenNULL, shapes are not mapped.- shape_values
Optional vector of shapes passed to
scale_shape_manual()whenshape_byis set. Use a named vector to map shapes to specific levels.- color_by
Optional column name in
sample_infoused for point colour. Defaults to the active grouping column.- use_vista_colors
Deprecated alias for
use_group_colors. When supplied, it overridesuse_group_colors.- palette
Optional qualitative palette name used when generating colours for non-group metadata levels.
- colors
Optional named character vector of manual colours overriding both
paletteand stored VISTA colours.- use_group_colors
Logical; when
TRUE, prefer the stored VISTA group colours when colouring by the grouping column.
Examples
v <- example_vista()
p <- get_mds_plot(v)
print(p)