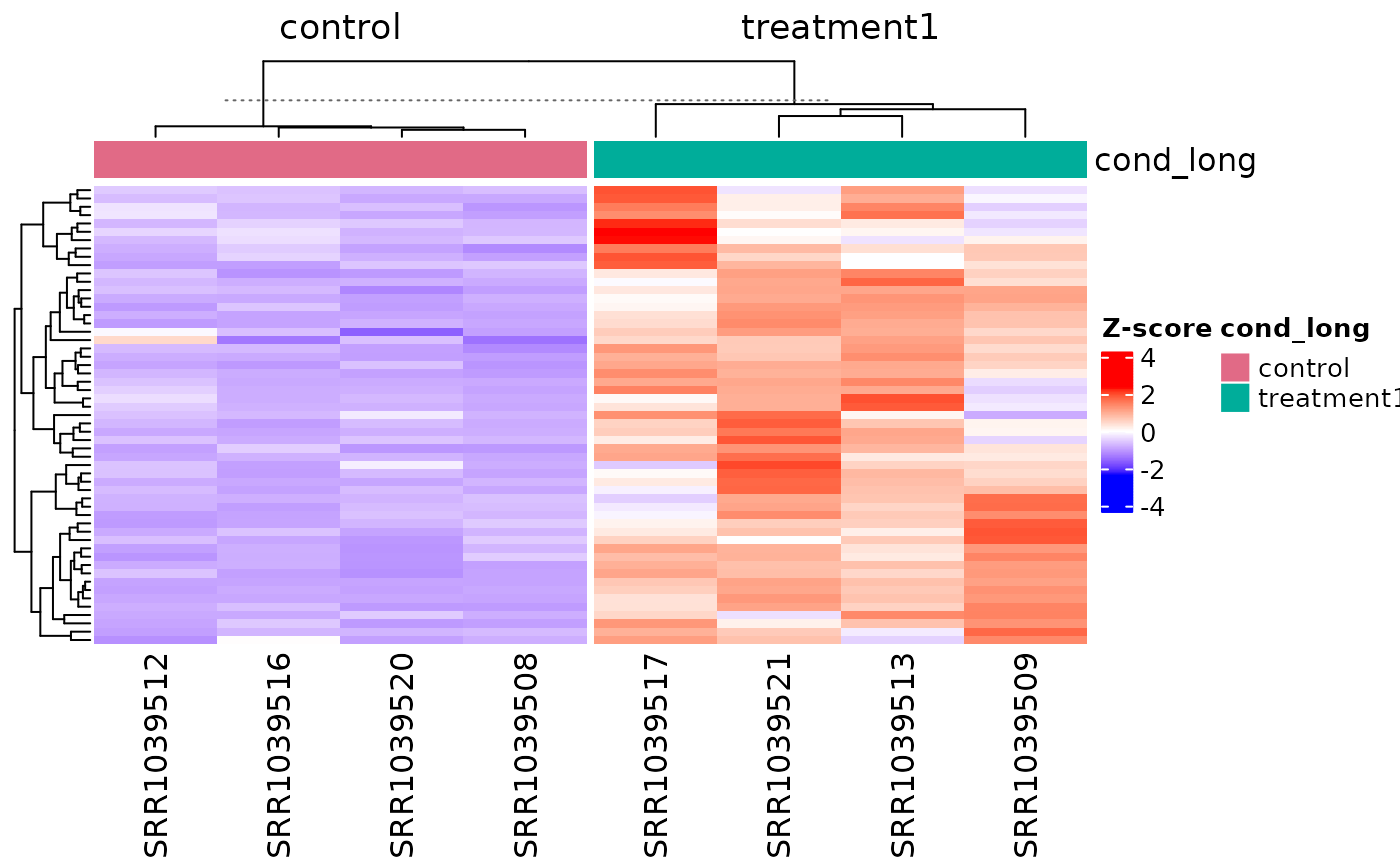
Plot pathway-specific expression heatmaps from enrichment output
Source:R/functional_analysis.R
get_pathway_heatmap.RdThis wrapper bridges enrichment results and expression heatmaps. It extracts
genes from selected pathways (via get_pathway_genes()), maps them to the
VISTA feature IDs, and forwards to get_expression_heatmap().
Usage
get_pathway_heatmap(
  x,
  enrichment,
  sample_group = NULL,
  pathways = NULL,
  top_n = 5,
  pathway_column = c("Description", "ID"),
  gene_column = c("auto", "geneID", "core_enrichment"),
  gene_sep = "/",
  gene_mode = c("union", "intersection"),
  gene_id_column = NULL,
  max_genes = NULL,
  return_type = c("heatmap", "both", "genes"),
  ...
)
Arguments
- x
A
VISTAobject.- enrichment
An
enrichResult/gseaResult, or a list with elementenrichas returned byget_*_enrichment()helpers.- sample_group
Character vector of group labels to include (same semantics as
get_expression_heatmap()).- pathways
Optional pathway names to include. When
NULL, top pathways are selected usingtop_n.- top_n
Number of top pathways used when
pathways = NULL. Default:5.- pathway_column
Pathway matching column,
"Description"(default) or"ID".- gene_column
Pathway gene-member column.
"auto"uses"geneID"or"core_enrichment"based on availability.- gene_sep
Delimiter used to parse pathway gene strings (default
"/").- gene_mode
How to combine pathway genes for plotting:
"union"(default) or"intersection".- gene_id_column
Optional column in
rowData(x)used to map enrichment genes back to VISTA rownames (e.g.,"SYMBOL"or"ENTREZID"). LeaveNULLwhen enrichment genes already match VISTA rownames.- max_genes
Optional cap on the number of genes passed to the heatmap.
- return_type
One of
"heatmap"(default),"both", or"genes".- ...
Additional arguments passed to
get_expression_heatmap().
Value
Depending on return_type:
"heatmap": aComplexHeatmapobject fromget_expression_heatmap()."both": list withheatmap,genes, andpathway_genes."genes": character vector of mapped genes selected for plotting.
Examples
if (requireNamespace("msigdbr", quietly = TRUE)) {
  vista <- example_vista()
  msig <- get_msigdb_enrichment(
    vista,
    sample_comparison = names(comparisons(vista))[1],
    regulation = "Both",
    msigdb_category = "H",
    from_type = "ENSEMBL"
  )
  genes <- get_pathway_heatmap(
    vista,
    enrichment = msig,
    sample_group = c("control", "treatment1"),
    top_n = 3,
    return_type = "genes"
  )
  head(genes)
}
#> [1] "ENSG00000003402" "ENSG00000004799"

# \donttest{
data("count_data", package = "VISTA")
data("sample_metadata", package = "VISTA")

vista <- create_vista(
  counts = count_data,
  sample_info = sample_metadata,
  column_geneid = "gene_id",
  group_column = "cond_long",
  group_numerator = "treatment1",
  group_denominator = "control"
)
#> estimating size factors
#> estimating dispersions
#> gene-wise dispersion estimates
#> mean-dispersion relationship
#> final dispersion estimates
#> fitting model and testing

msig <- get_msigdb_enrichment(
  vista,
  sample_comparison = names(comparisons(vista))[1],
  regulation = "Up",
  species = "Homo sapiens",
  from_type = "ENSEMBL"
)

get_pathway_heatmap(
  vista,
  enrichment = msig,
  sample_group = c("control", "treatment1"),
  top_n = 3,
  value_transform = "zscore",
  annotate_columns = TRUE,
  summarise_replicates = FALSE
)

# }
# }